Case study · Venezuela · 24 June 2026

Four million people.
No damage grading.

Two earthquakes struck north-central Venezuela 32 seconds apart: M7.2 near San Felipe, then M7.5 offshore. Europe's emergency mapping service graded the coast within days. In seven urban areas home to four million people, every high-resolution image came back "not produced". This is what we found, and what we did with it.
Event us6000t7zc · us6000t7zpPAGER redPrepared October 2026
01 · The gap

Seven areas the satellites never graded.

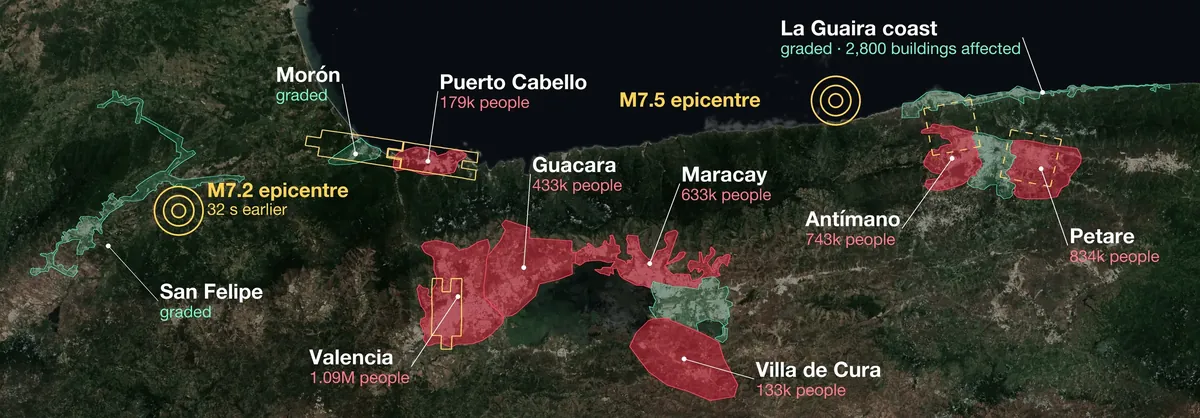
Copernicus EMS graded damage in central Caracas, along the La Guaira coast and in San Felipe, Morón and Santa Cruz. In seven other areas, every image acquired between 25 and 27 June ended "not produced", citing remote sensing limitations. The activation is now closed. Copernicus EMS has published no damage grading for them.

Map of north-central Venezuela: seven red areas with no damage grading, green graded areas, two epicentres
attempted, not producedgradedopen commercial capture, 26–27 June
4.0million
people in seven areas with no damage grading

Valencia, Maracay, Guacara, Puerto Cabello, Villa de Cura, and the Caracas districts of Petare and Antímano.

1.5million
of them live inside open high-resolution captures

Planet's Crisis Response release holds 50 cm captures of large parts of four of the areas, taken one to three days after the earthquakes.

70min
Petare, 27 June

13:48 UTC: the emergency service's image, later marked not produced. 14:58 UTC: an open capture of the same neighbourhoods under 10% cloud.

02 · The timing

The clear window was there. Minute by minute.

AreaEmergency service image (UTC) → outcomeOpen capture, 50 cm
Puerto Cabello177,000 in capture26 Jun 14:03 and 27 Jun 15:16 → not produced26 Jun 11:48 · 21% cloud · two hours before the first image
Petare654,000 in capture27 Jun 13:48 → not produced27 Jun 14:58 · 10% cloud · seventy minutes later
Valencia449,000 in capture26 Jun 14:04 → not produced26 Jun 19:10 · 10% cloud · same day
Antímano area, north228,000 in capture25 Jun 15:17 → not produced26 Jun 15:05 · 11% cloud · next day
Maracay, Guacara, Villa de Cura25–27 Jun → not producedNo open capture
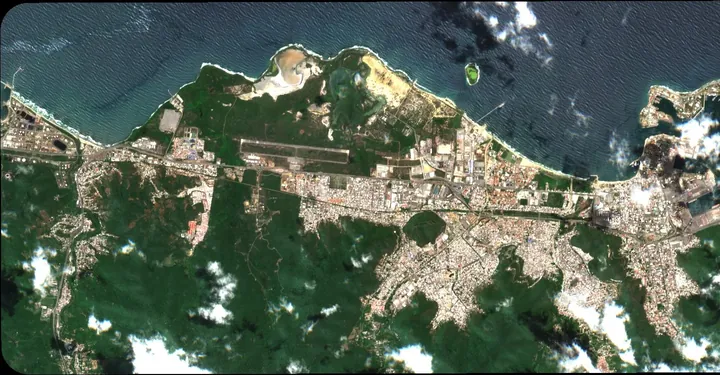
Puerto Cabello from Sentinel-2 on 25 June 2026, mostly clear of cloud
Puerto Cabello, 25 June 2026, 15:10 UTC. The day after the earthquakes, 93% of the area was clear of cloud at 10 m: enough to see the sky, not to grade a building. Contains modified Copernicus Sentinel data 2026.
03 · The city in 3D

Catia La Mar, building by building.

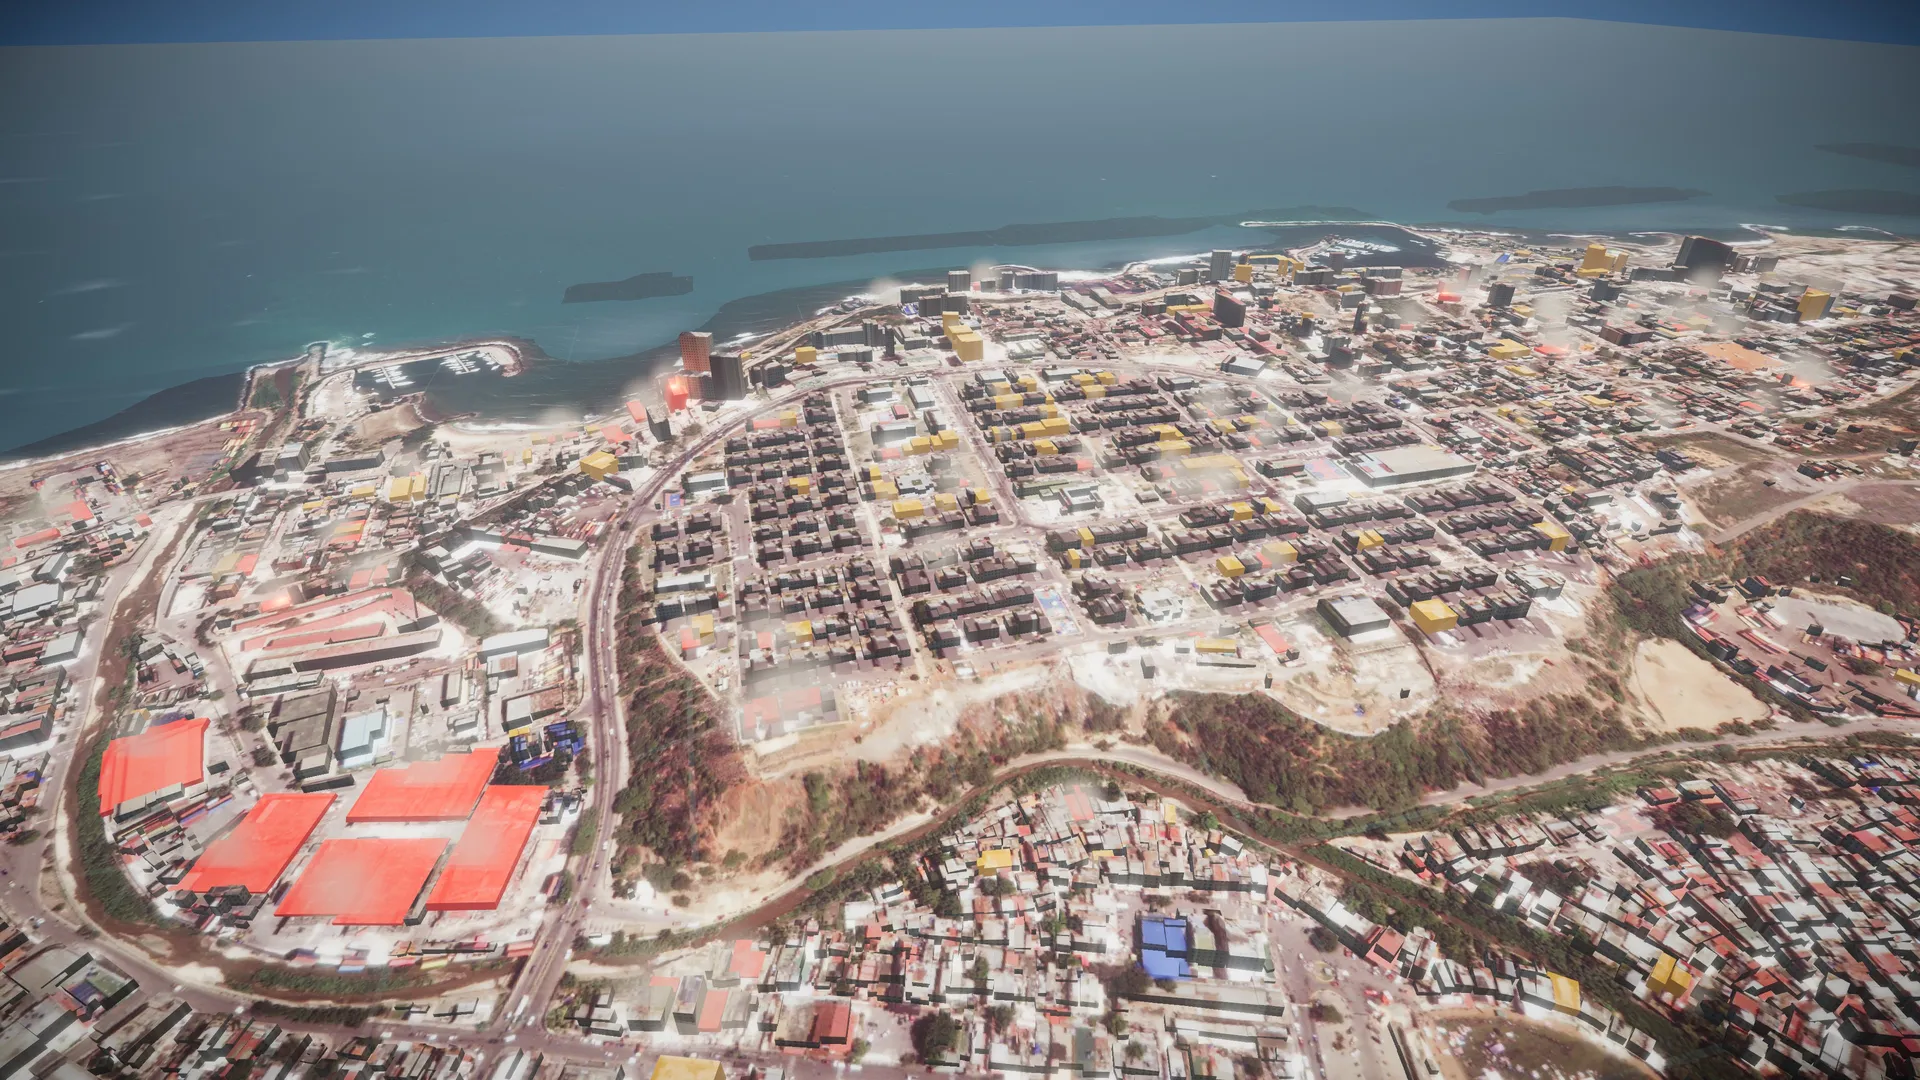
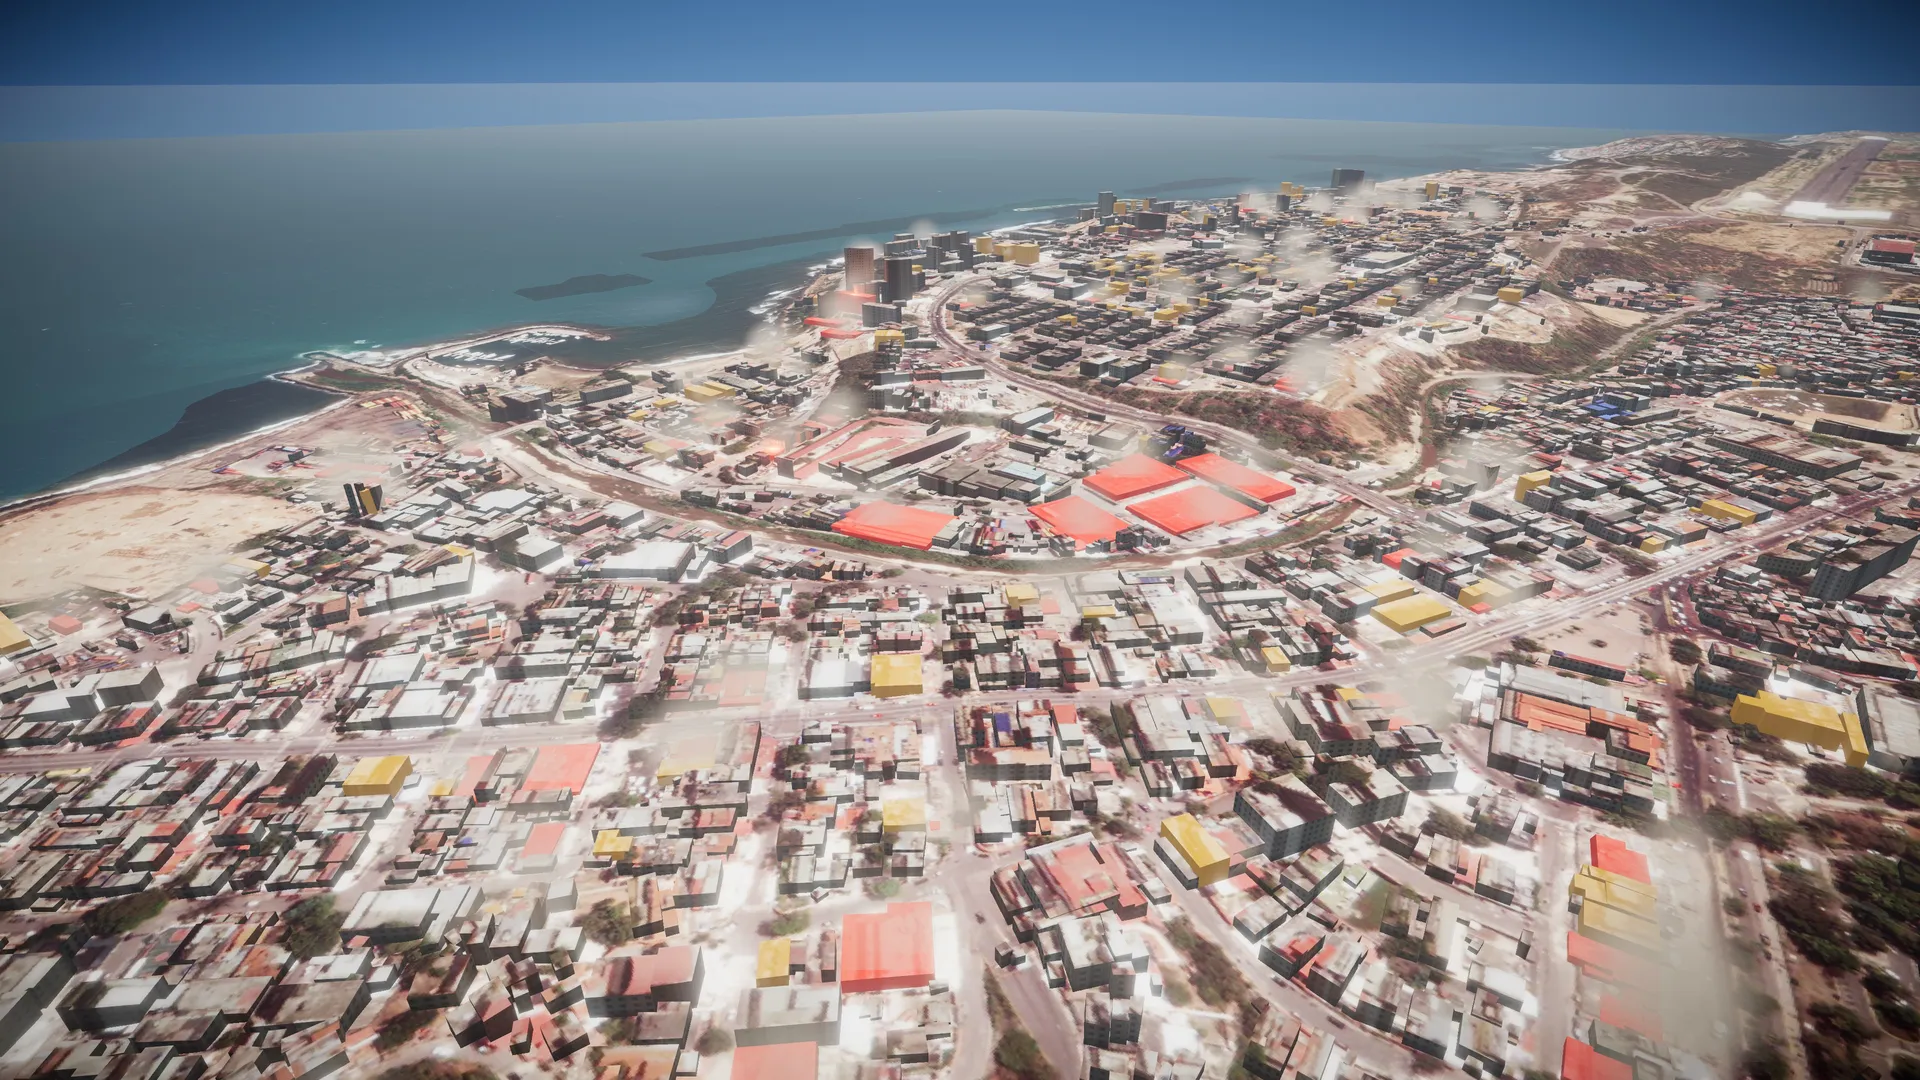
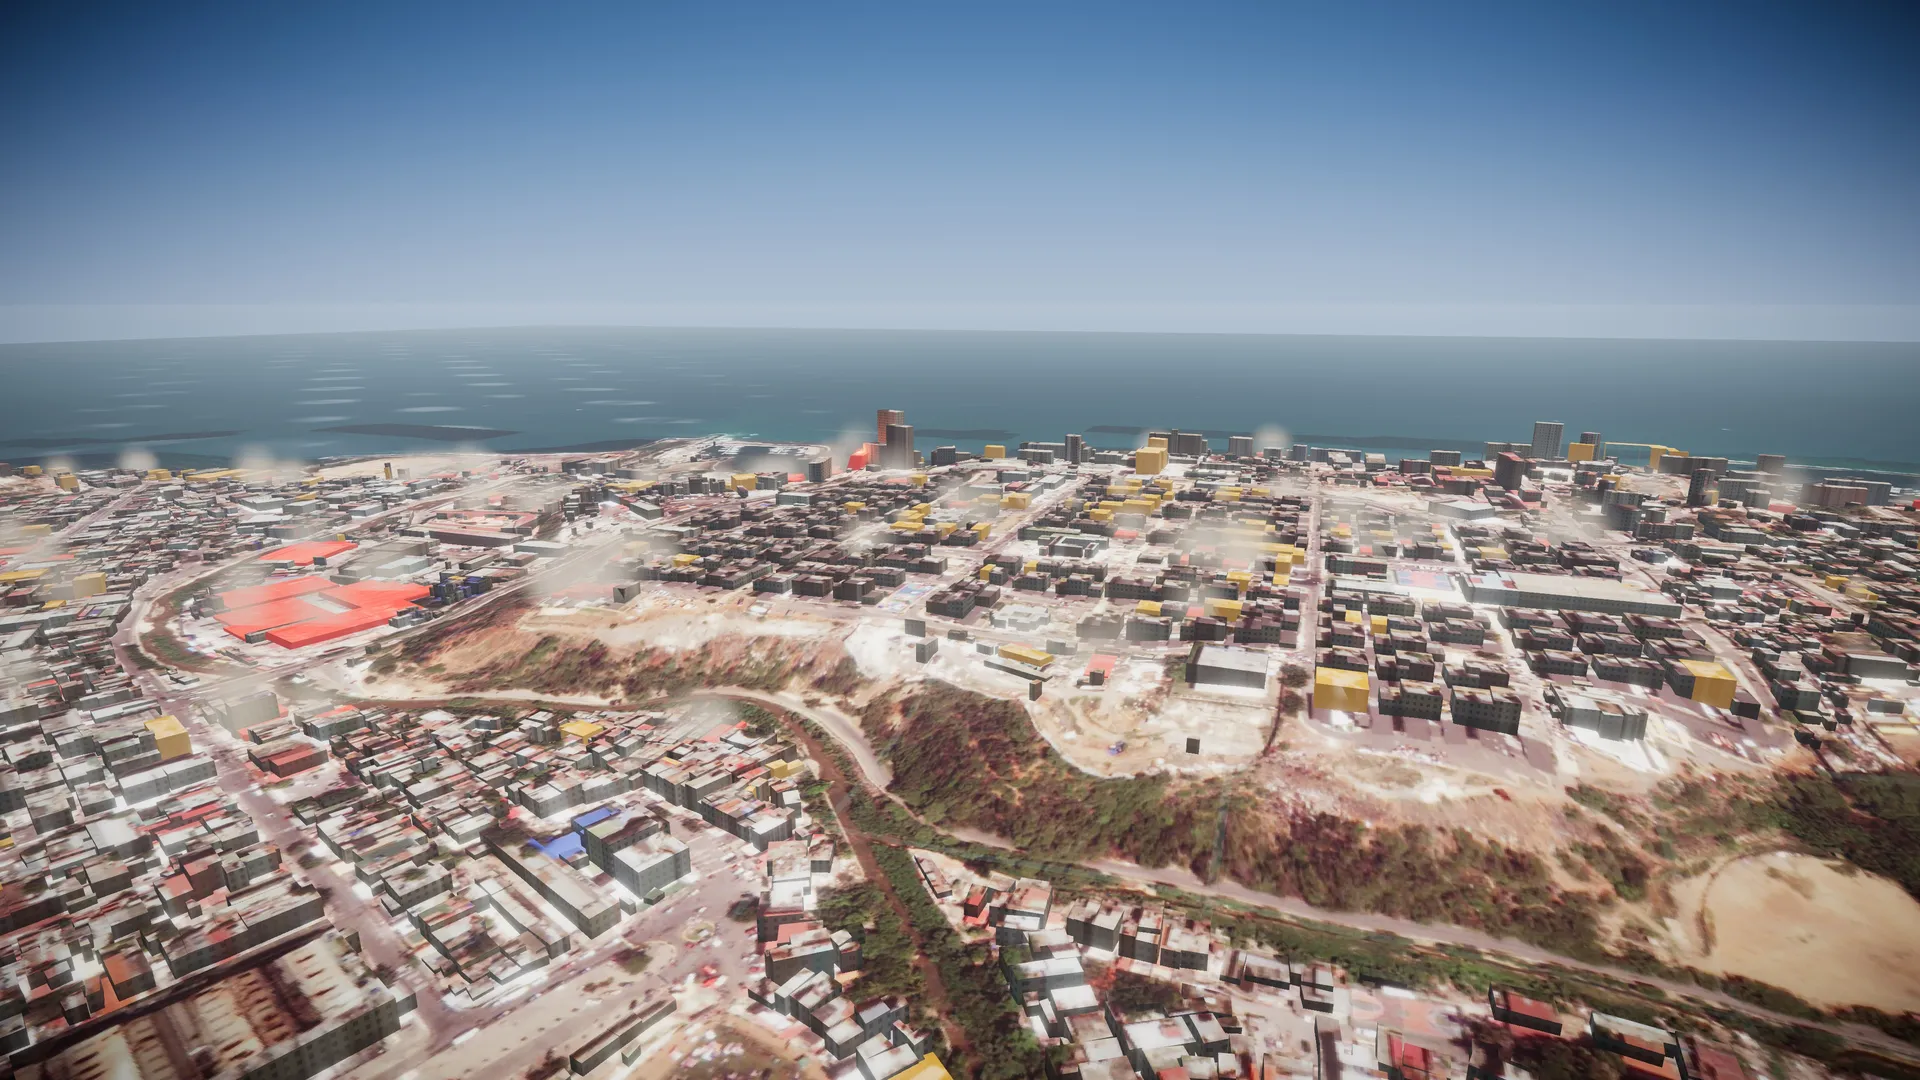
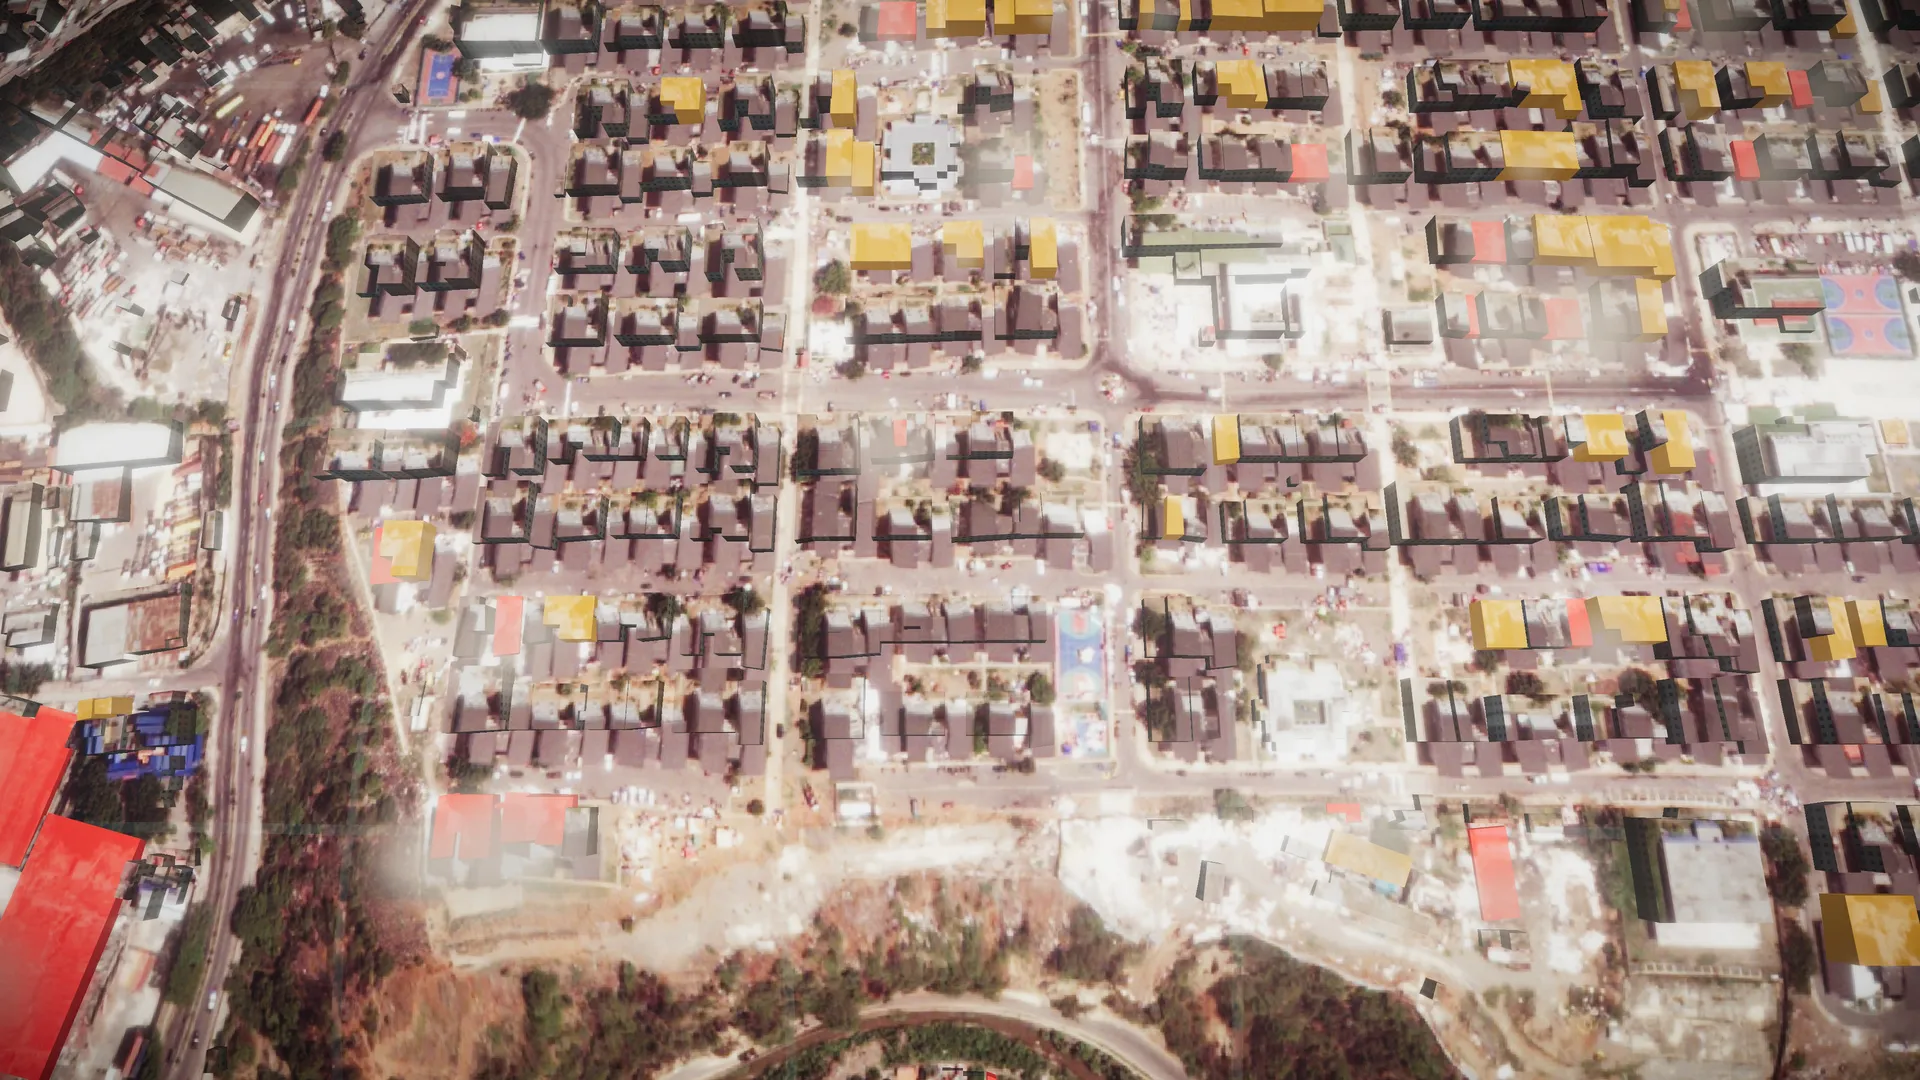
Where the sky allowed it, this is what a damage grading becomes: 9,131 buildings rebuilt in 3D, the post-event image on every roof, each one coloured by the grade Copernicus EMS assigned it. Red: destroyed. Amber: damaged.

04 · Radar, tested

What radar saw where Copernicus graded.

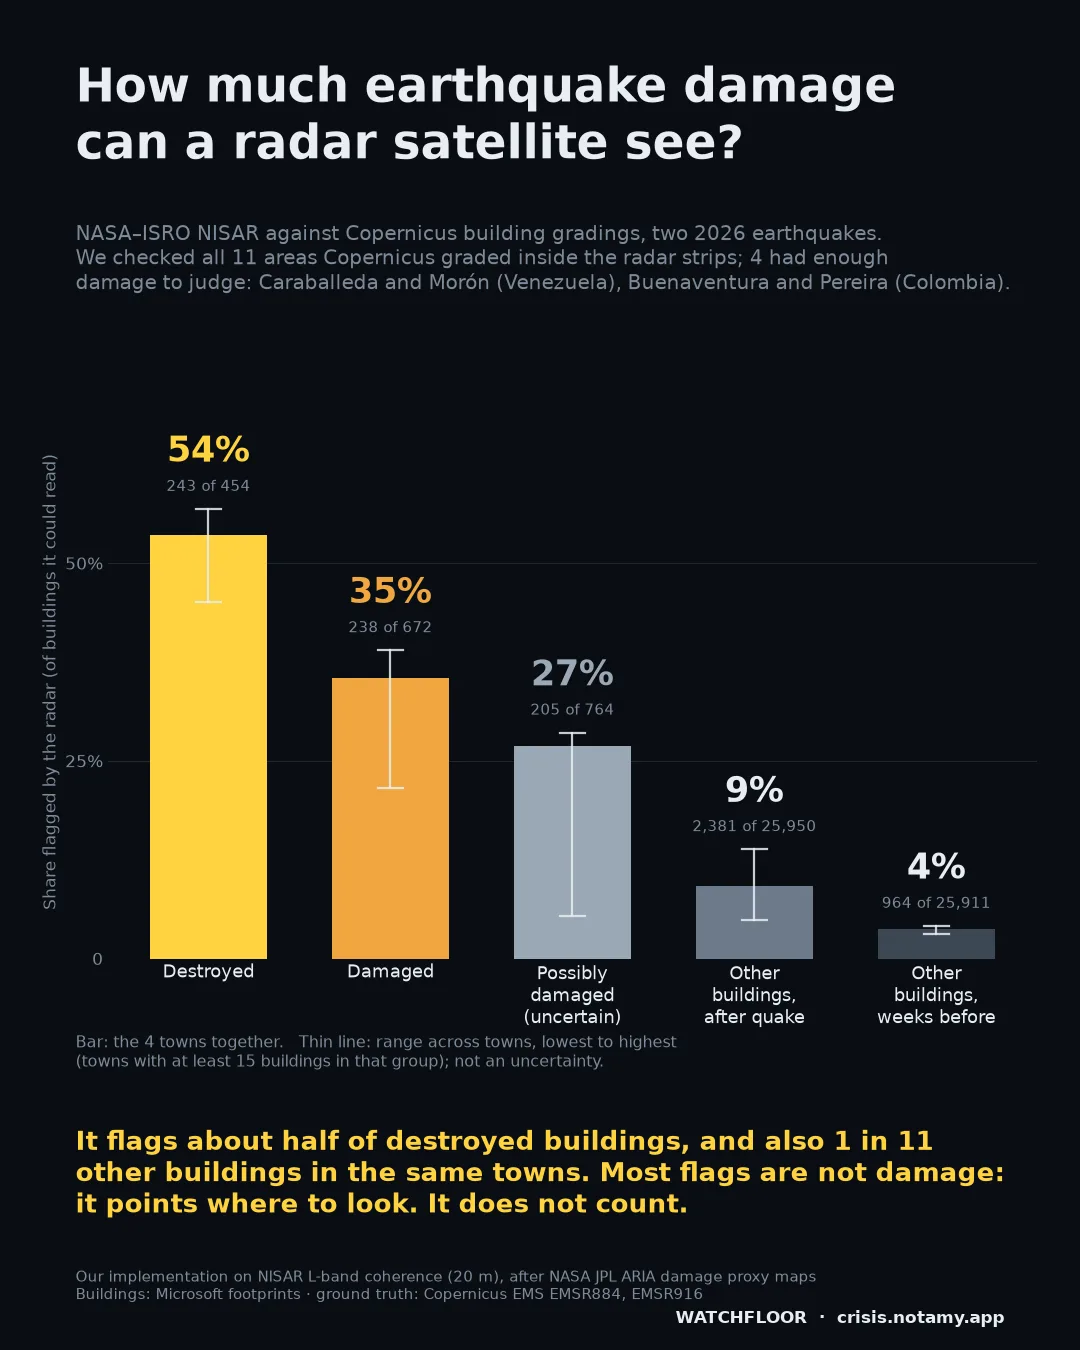
NASA–ISRO's NISAR radar sees through cloud. We tested its change map building by building against the Copernicus gradings. On this coast, in Caraballeda, it flagged 162 of 285 destroyed buildings. In Morón, 7 of 8 destroyed. In San Felipe, none of 14 damaged buildings.

In the towns that were hit it also flagged about 1 in 11 other buildings, so most flags are not damage. It points where to look. It does not count damage, and a quiet place is not proof that it is safe.

This test covers only the areas Copernicus graded. The radar was not tested in the seven areas without a grading, and this page does not claim it covers them.

Share of buildings flagged by the radar, by Copernicus grade, in the four towns with enough damage to judge
Share of buildings the radar flagged, by Copernicus grade, in the four towns with enough damage to judge: Caraballeda and Morón (Venezuela), Buenaventura and Pereira (Colombia). Watchfloor test of NASA–ISRO NISAR against Copernicus EMS EMSR884 and EMSR916.
05 · From buildings to people

From an image to a truck.

A damage map matters only when it ends in a decision. In this 2.6 km window of coast:

Image
0.5 m
post-event, graded by Copernicus EMS
Buildings
393
destroyed (163) or damaged (230)
People
≈4,300
estimated living in them
Food
2.4 t/day
2,100 kcal ration, ≈0.55 kg per person
Plan
≈71 t
30 days · four 20-tonne trucks

Planning figures, not distribution records. Run on the open captures of the seven areas, once buildings are graded, the same steps would reach 1.5 million people.

06 · The report

Two pages. Every number sourced.

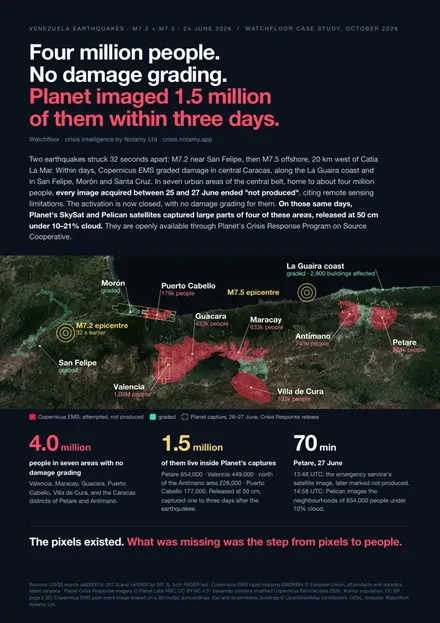
Cover of the Watchfloor case study report

The full case study: the gap map, the minute-by-minute audit, Catia La Mar in 3D, and how it goes from buildings to people to food. Written in plain language for the person who has to act.

Watchfloor

Where the satellites stop, we keep going.

Every analysis starts from a multi-source gather: hazard monitors, satellite imagery, population and food-security data, and our own measurements of shaking, exposure and damage. Ask for one on your next event.

Sources: USGS events us6000t7zc (M7.2) and us6000t7zp (M7.5), PAGER red · Copernicus EMS rapid mapping EMSR884 © European Union: areas, products, statuses, image times and statistics, latest versions · Planet Labs PBC Crisis Response release: capture times and cloud cover from published metadata (imagery not shown) · Kontur population, CC BY · map basemap contains modified Copernicus Sentinel data 2026 · 3D: post-event image and damage grades © European Union, Copernicus EMS; pre-event and surrounding imagery: Esri and its providers; buildings © OpenStreetMap contributors, ODbL. People in capture: residents inside each capture's footprint within the EMS area. People in buildings and food figures: Watchfloor estimates. The graded Caracas product does not overlap Petare or Antímano. Radar: NASA–ISRO NISAR, distributed by the Alaska Satellite Facility DAAC; buildings for the radar test: Microsoft Global ML Building Footprints, ODbL; radar flags: Watchfloor measurements.