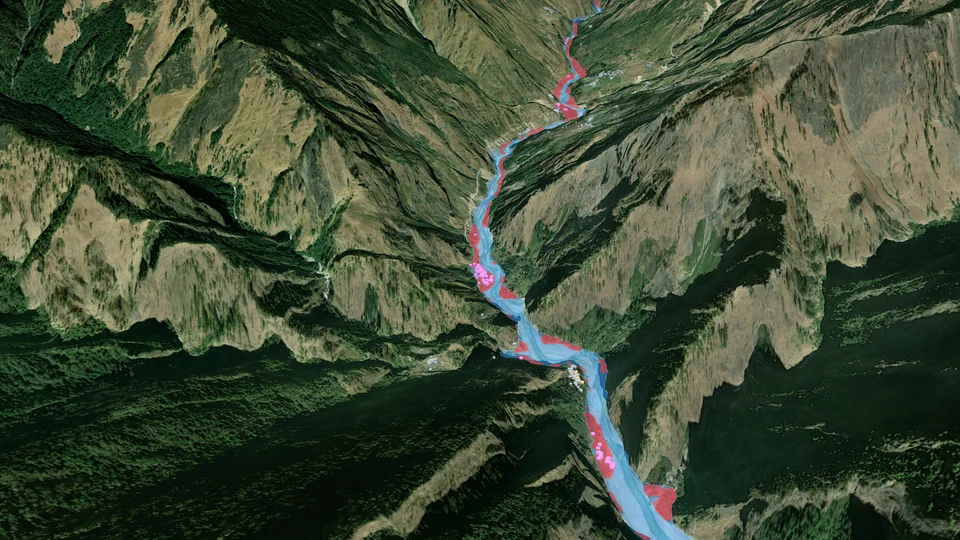
The Budhi Gandaki valley near Jagat in 3D: a sharp image of the valley from before the flood, with the mud channel measured on 11 October drawn in blue and red and the buildings beside it in pink

Base image before the flood: Esri World Imagery · mud channel and buildings: measured on 11 October

Case study · Nepal · 11 October 2026

A river of mud.
Measured in hours.

Before dawn on 11 October, a blocked mountain stream in the Tsum valley gave way. A torrent of mud and rocks ran about 65 km down the Syar Khola and the Budhi Gandaki to Arughat. We read the open satellite data of that morning and every mapped building along the river.
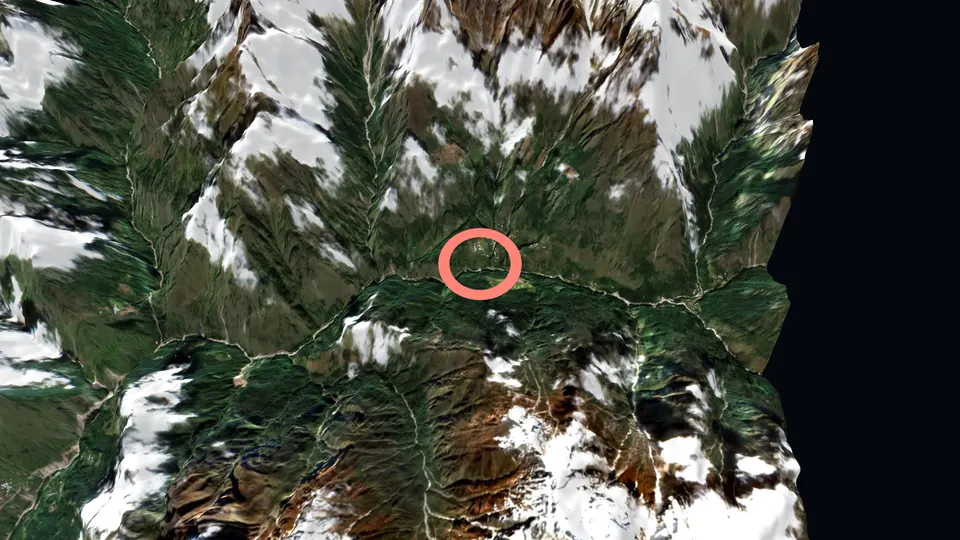
Gorkha district, Gandaki ProvinceSentinel-2 · Sentinel-1Prepared October 2026
01 · What happened

A blocked stream gave way before dawn.

Authorities provisionally blame a landslide that dammed a stream between Lokpa and Chumling, in the Tsum valley. The exact cause is still under study. The five people missing are herders from Chumchet.

204
homes damaged
550+
households affected
5
people missing
300+
people rescued
100+
foreign trekkers stranded

Nepal's National Disaster Risk Reduction and Management Authority (NDRRMA), as of 13 October; trekkers: Manaslu Conservation Area Project.

≈04:30The flood begins, according to the Department of Hydrology and Meteorology.
04:45Villagers downstream start warning each other by phone.
05:30The first official warning.
06:00The river at Arughat stands at 2.27 m.
06:03A radar satellite, Sentinel-1, passes over the valley while the flood is running.
08:408.43 m at Arughat. The gauge and its bridge are swept away.
10:56Sentinel-2 photographs the valley: the river is a channel of mud.

Times in Nepal time.

02 · The film

From the source to Arughat, in 77 seconds.

03 · From pictures to answers

Images show the flood. We measured where it reached.

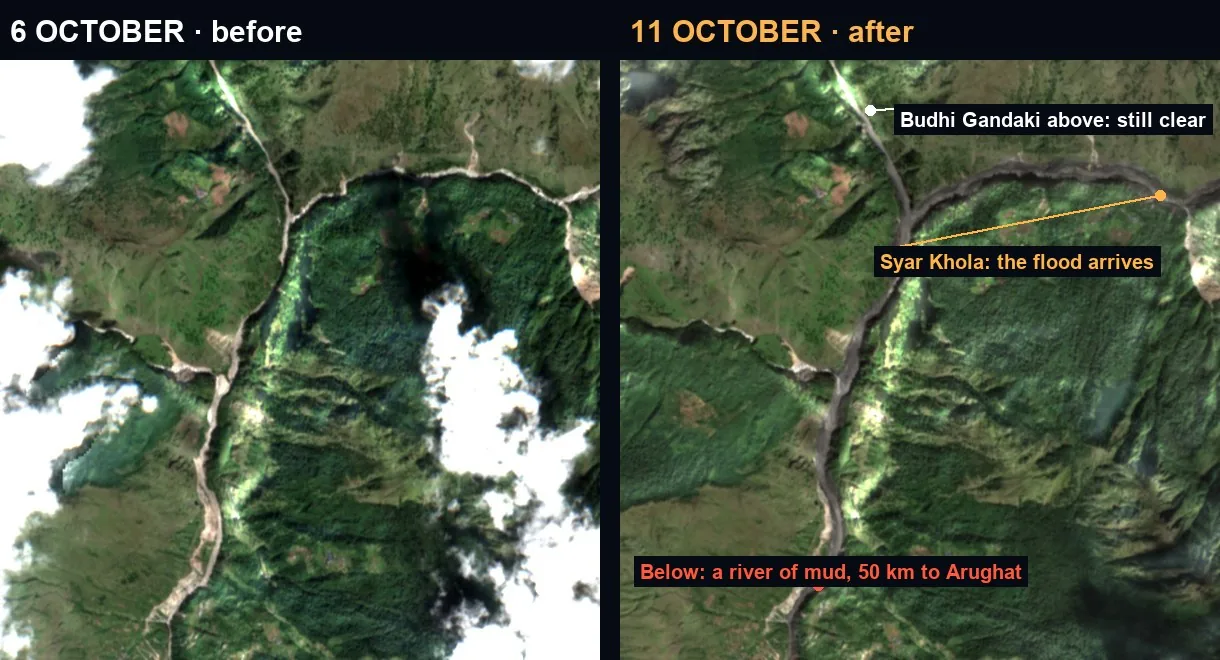
The Nyak confluence on 6 and 11 October 2026: the Syar Khola turned to mud, the Budhi Gandaki above it still clear
The Nyak confluence, 6 and 11 October 2026. Above it, the Budhi Gandaki stays clear: the mud came down the Syar Khola. Contains modified Copernicus Sentinel data 2026.

A picture shows a flood. A response team needs to know where to check first. So every measure on this page is set against the same measure on a normal day.

A building near the channel is a place to check, not a confirmed loss. The authorities' counts and the teams on the ground come first.

6.0 km²
mud channel · 11 Oct, 10:56

1.8 km² of it was green on 6 October: forest and fields stripped or buried. 15% of the river corridor was under cloud, so this is a lower bound.

190
against 29 before the flood

Mapped buildings within 20 m of the mud channel. On 6 October, 29 stood that close to the river. About 120 of them are between Salleri and Machhakhola.

19%
against 2.5% on normal days

Share of the river from Nyak to Jagat that changed sharply on radar at 06:03, during the flood. Between two normal passes, 2.5%. Same pixels, same masks.

04 · The valley in 3D

Walk the valley. Switch the satellites.

Before and after, the mud channel and the radar pass, on the real relief, with every mapped building along the river. Follow the flood stop by stop, or fly it yourself.

The upper valley in 3D, where the flood started Explore the valley in 3DOpen · about 6 MB
05 · Where to check first

Village by village, before and after.

Place6 Oct11 OctReported
Sallerimay include the hydropower camp364Budhigandaki hydropower camp damaged
Machhakhola219
Jagat318about 115 trekkers were here
Aruarbang013
Sirdibas012
Dobhan111hydropower camp and Bailey bridge lost
Arughat Bazar57gauge and bridge swept away

Mapped buildings within 20 m of the river on 6 October and of the mud channel on 11 October.

Early counts report 45 houses destroyed and 27 damaged from Ghattekhola to Machhakhola: the stretch where our map finds most of the buildings at the mud's edge.

Downstream, NDRRMA counts 64 damaged homes in Arughat and 58 in Tripurasundari (Dhading). Few buildings there stand at the channel on our map, so our measure misses most of that damage: it sees the channel, not the water and mud that reached houses beyond it. Our map points where to look first. It does not count damage.

06 · What this cannot tell

The limits, said plainly.

The source area was under cloud on 11 October; it is shown as it was on 6 October. Sentinel-2 sees 10 m: a channel, not a house. The image of 10:56 caught a flood still running, so the channel is a snapshot, not its peak. Buildings are those mapped by OpenStreetMap volunteers; new or unmapped ones are missing. The radar reads a steep gorge, where slopes hide parts of the river from the satellite. The next NASA–ISRO NISAR pass over the valley is on 15 October.

Watchfloor

Where the satellites stop, we keep going.

Every analysis starts from a multi-source gather: hazard monitors, satellite imagery, population and food-security data, and our own measurements. Ask for one on your next event.

Sources: Nepal's National Disaster Risk Reduction and Management Authority (homes, households, missing, rescued; as of 13 October) · Department of Hydrology and Meteorology (Arughat gauge, flood onset) · Manaslu Conservation Area Project (trekkers) · contains modified Copernicus Sentinel data 2026 (Sentinel-2 L2A, 6 and 11 October; Sentinel-1) · OPERA RTC-S1, NASA JPL, distributed by the Alaska Satellite Facility DAAC (11 October 06:03, 29 and 17 September) · Copernicus DEM GLO-30 © DLR e.V. 2010–2014 and © Airbus Defence and Space GmbH 2014–2018, provided under COPERNICUS by the European Union and ESA · buildings, rivers and places © OpenStreetMap contributors, ODbL · opening image: Esri World Imagery (Esri, Maxar, Earthstar Geographics and the GIS User Community), taken before the flood, at true relief. Mud channel, buildings near it and radar change: Watchfloor measurements. Relief in the explorer and the film exaggerated 1.5 times; white on the relief: snow or cloud.