Augmented Crisis Intelligence

Analytical power to any organisation — or any one person — from an architecture unique in the world.

An assistant to your analysis: it gathers from many sources, drafts, checks every figure against its source and delivers the report. You ask the question.

Because saving lives should depend on what humanity knows, not on the limits of what any one human can know.

The grain harbour of Odesa in 3D: silos and quays along the empty harbour, from the Sentinel-2 image of 3 October 2026 and OpenStreetMap buildings
Case study · Black Sea · July–October 2026

The grain is trapped. Not missing.

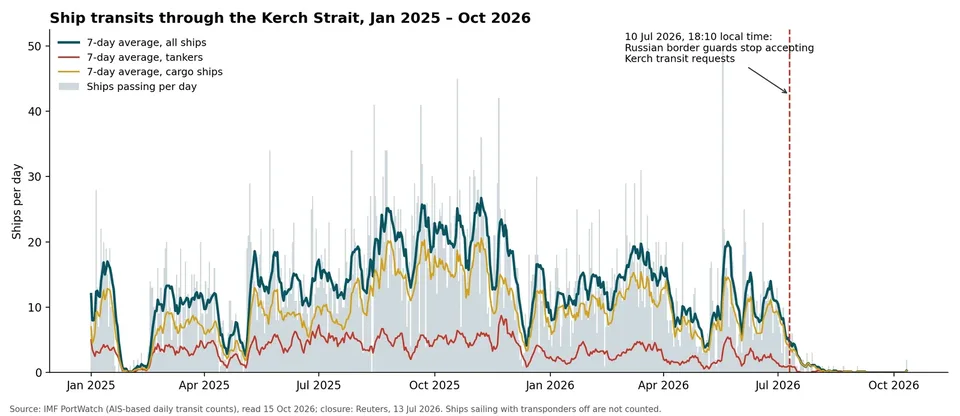
  • On 10 July 2026 Russia closed the Kerch Strait. It carried 11 ships a day in June and one in all of September.
  • For the first time in this war, both shores of the Black Sea are constrained at once. We followed the trade, the fuel, the food, and six of the ports from space.

See the Black Sea case study The Black Sea globeThe ports up close
Kerch Strait · Black Sea and Danube portsSentinel-1 · Sentinel-2

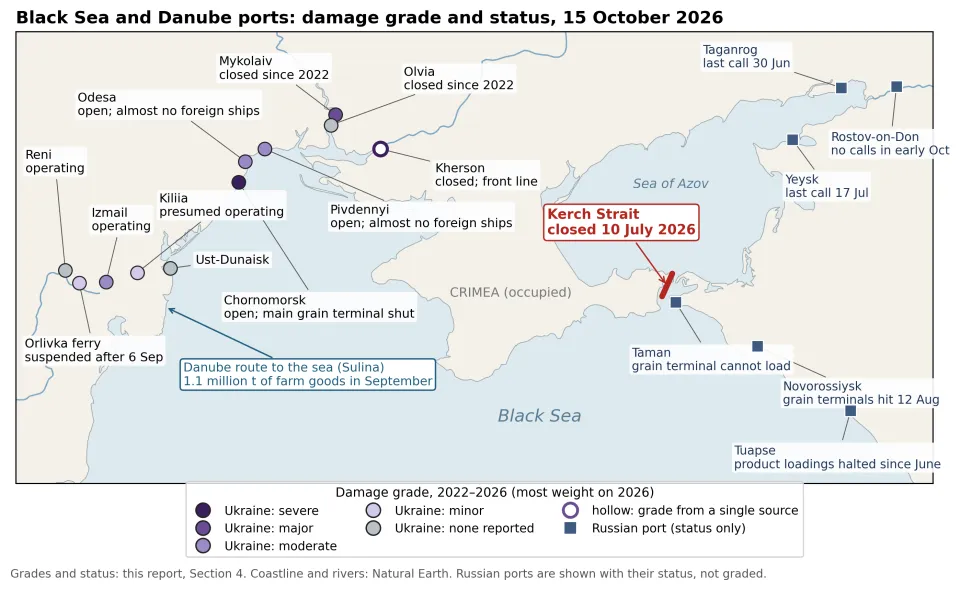
Map of the Black Sea and Danube ports by damage grade and status on 15 October 2026
The ports by damage grade and status
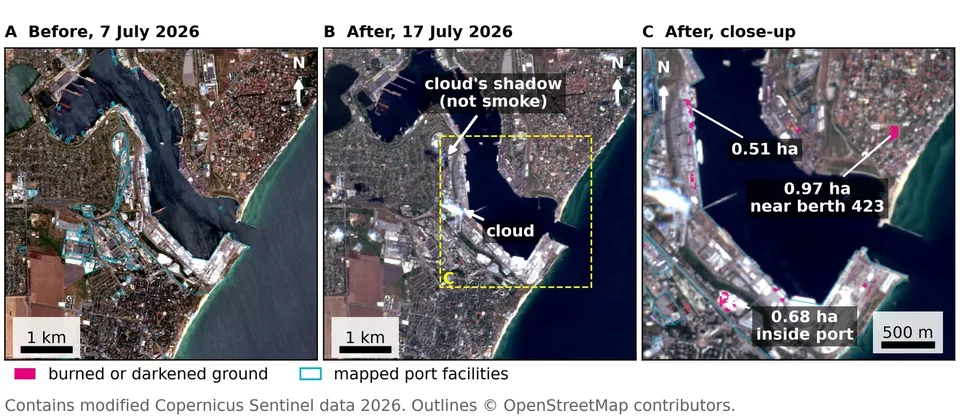
Chornomorsk on 7 and 17 July 2026: burned or darkened ground inside the port
Chornomorsk, 7 and 17 July 2026
Ships through the Kerch Strait per day, almost none after the 10 July closure
Ships through the Kerch Strait

Odesa's grain harbour, 3 October 2026 · contains modified Copernicus Sentinel data 2026 (Sentinel-1 and Sentinel-2) · buildings and port outlines © OpenStreetMap contributors, ODbL · coastline and rivers: Natural Earth · Kerch Strait transits: IMF PortWatch.
Case study · Venezuela · 24 June 2026

Four million people. No damage grading.

  • Seven areas the satellites never graded, four of them timed image by image against open captures.
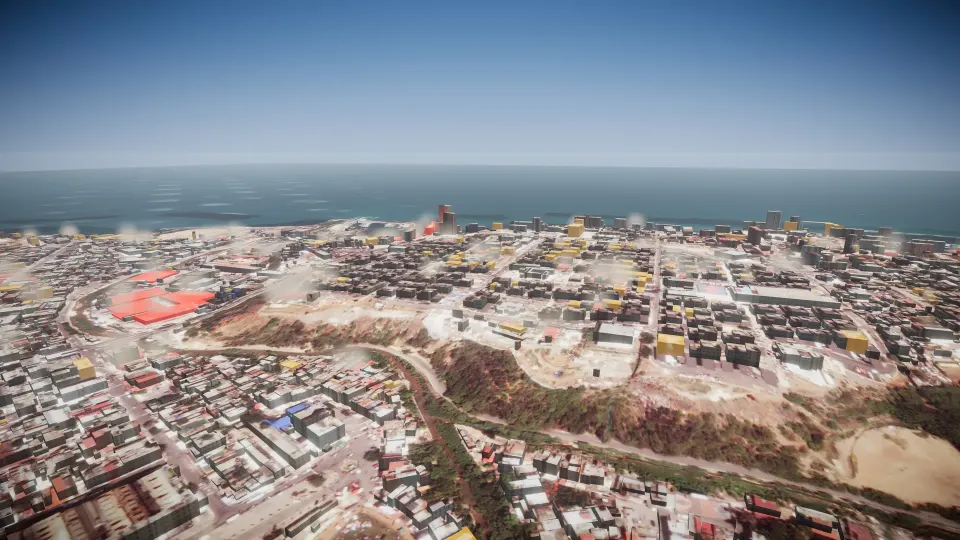
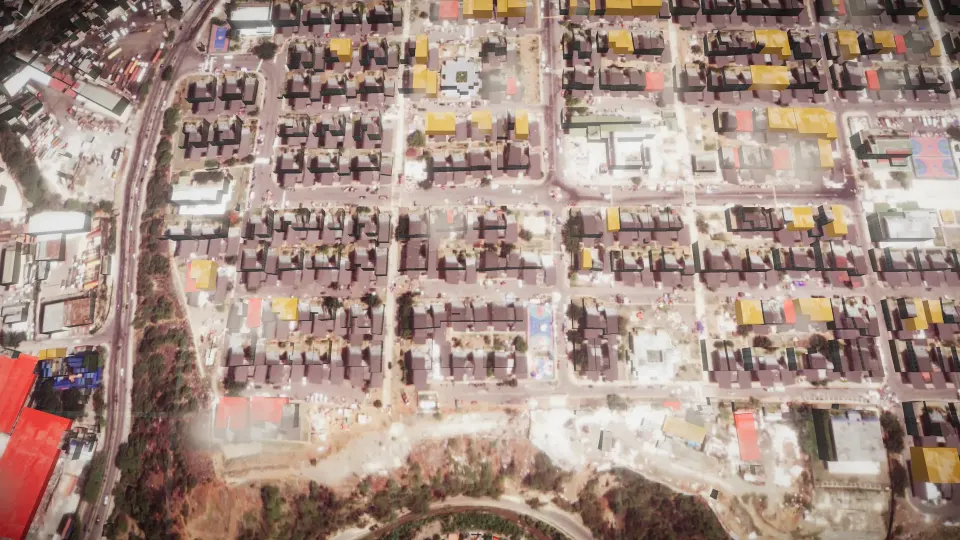
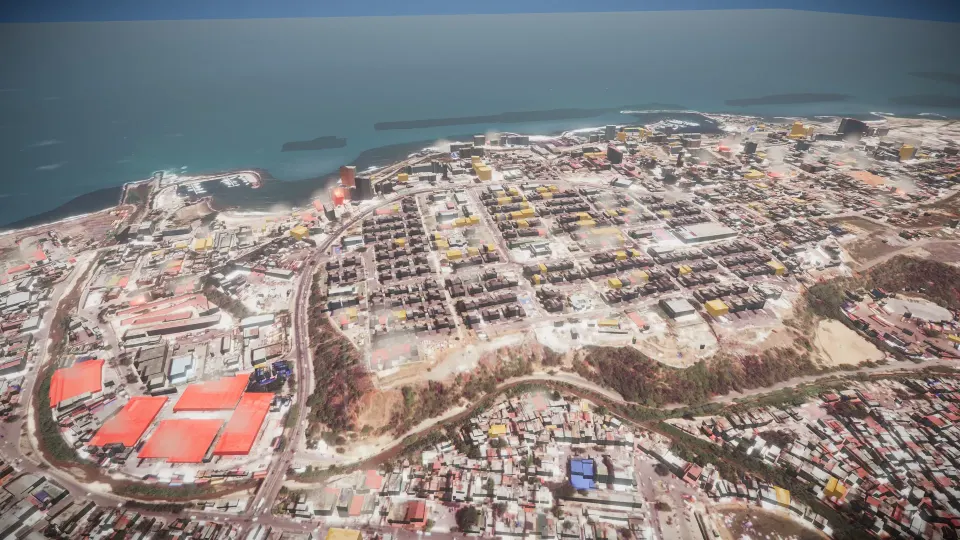
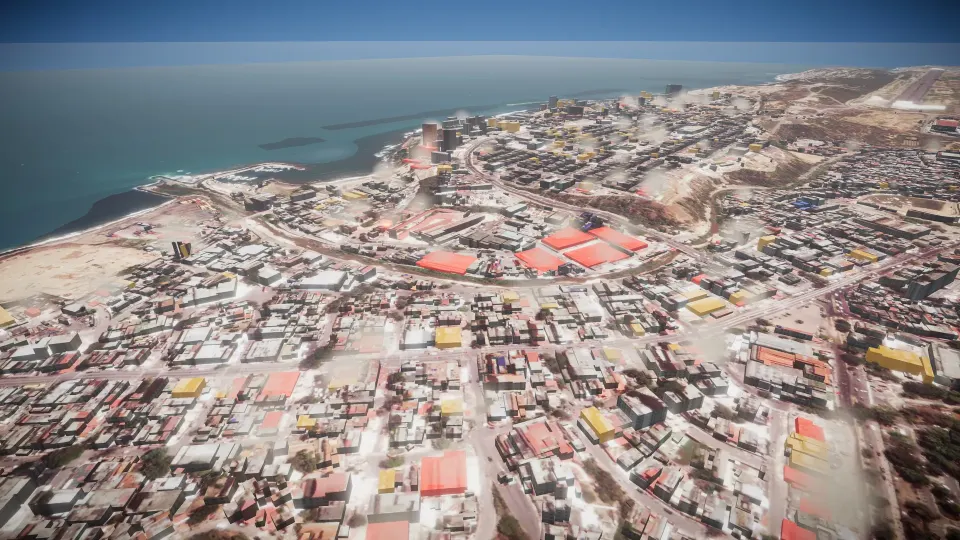
  • Catia La Mar, on the coast Copernicus did grade, rebuilt in 3D: 9,131 buildings, each coloured by its grade.

See the case study

Catia La Mar in 3D, looking west, each building coloured by its damage grade
Catia La Mar, looking west
Catia La Mar in 3D, a low view along the streets
Street level
Catia La Mar in 3D, from above: red destroyed, amber damaged
From above. Red: destroyed. Amber: damaged.

3D: post-event image and damage grades © European Union, Copernicus EMS; pre-event and surrounding imagery: Esri and its providers; buildings © OpenStreetMap contributors, ODbL. Contains modified Copernicus Sentinel data 2026.

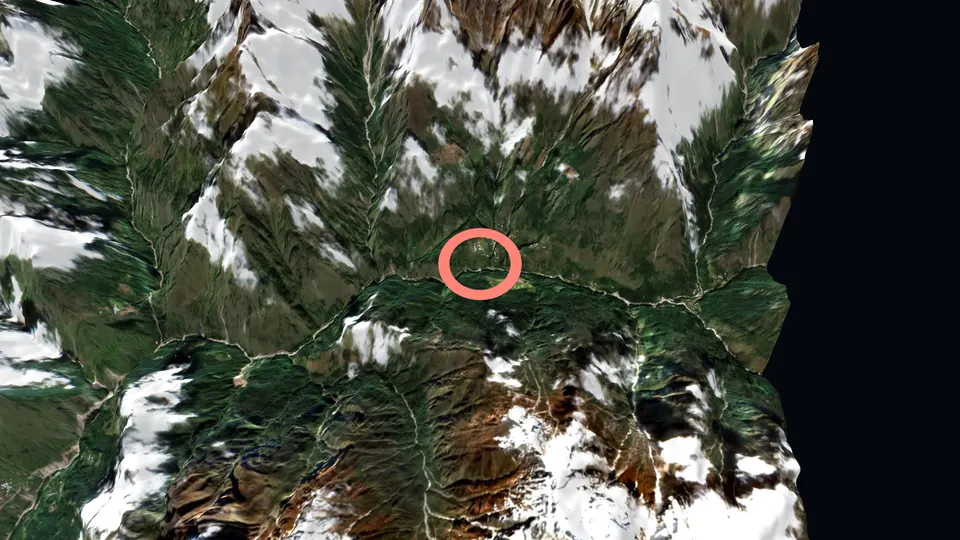
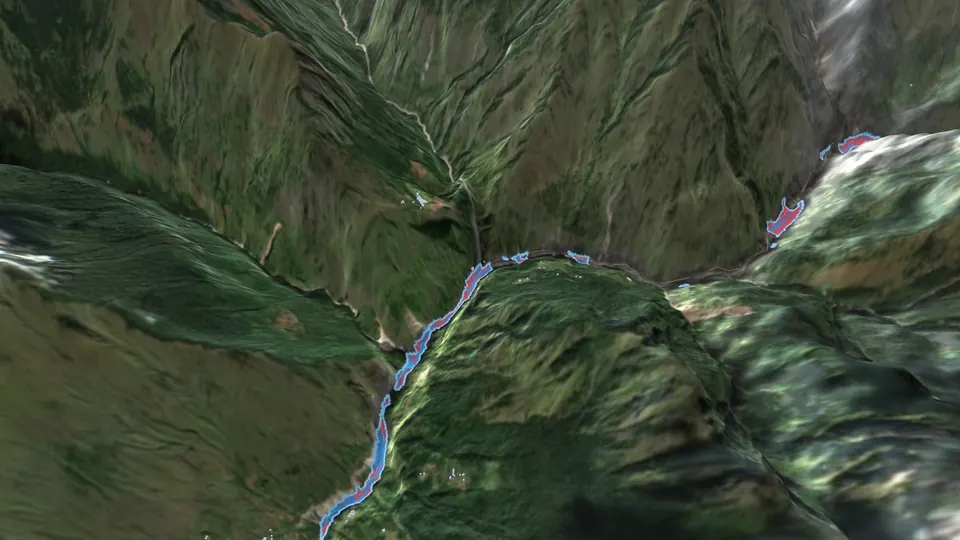
The Budhi Gandaki valley near Jagat in 3D: a sharp image of the valley from before the flood, with the mud channel measured on 11 October drawn in blue and red and the buildings beside it in pink
Case study · Nepal · 11 October 2026

A river of mud. Measured in hours.

  • Before dawn on 11 October, a torrent of mud and rocks ran about 65 km down the Syar Khola and the Budhi Gandaki to Arughat.
  • We read the open satellite data of that morning and every mapped building along the river.

See the Nepal case study Explore the valley in 3D

Gorkha district, Gandaki ProvinceSentinel-2 · Sentinel-1

The upper valley in 3D, where the flood started
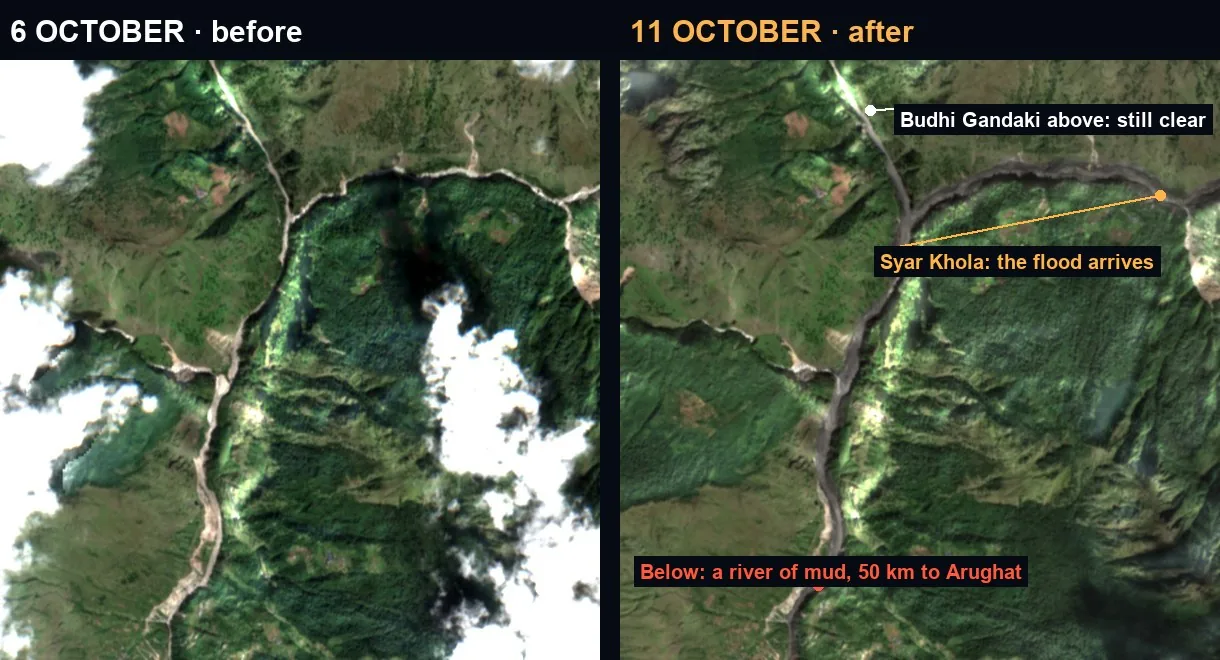
The Nyak confluence on 6 and 11 October 2026: the Syar Khola turned to mud, the Budhi Gandaki above it still clear
The Nyak confluence, 6 and 11 October 2026
The film: from the source to Arughat, in 77 seconds

Opening image: Esri World Imagery (Esri, Maxar, Earthstar Geographics and the GIS User Community), taken before the flood, at true relief · mud channel and buildings: measured on 11 October. Contains modified Copernicus Sentinel data 2026 (Sentinel-2 L2A, 6 and 11 October; Sentinel-1) · OPERA RTC-S1, NASA JPL, distributed by the Alaska Satellite Facility DAAC · Copernicus DEM GLO-30 © DLR e.V. 2010–2014 and © Airbus Defence and Space GmbH 2014–2018, provided under COPERNICUS by the European Union and ESA · buildings, rivers and places © OpenStreetMap contributors, ODbL. Mud channel, buildings near it and radar change: Watchfloor measurements.

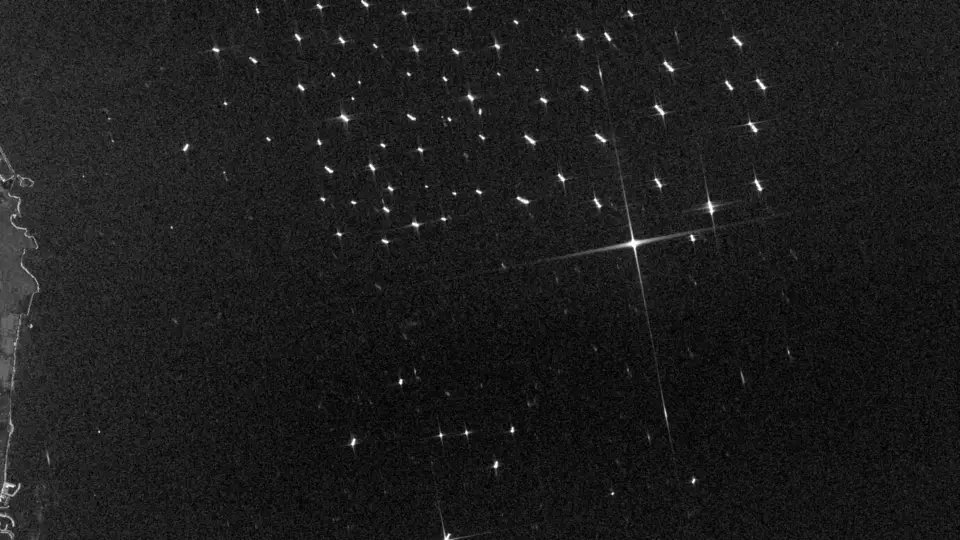
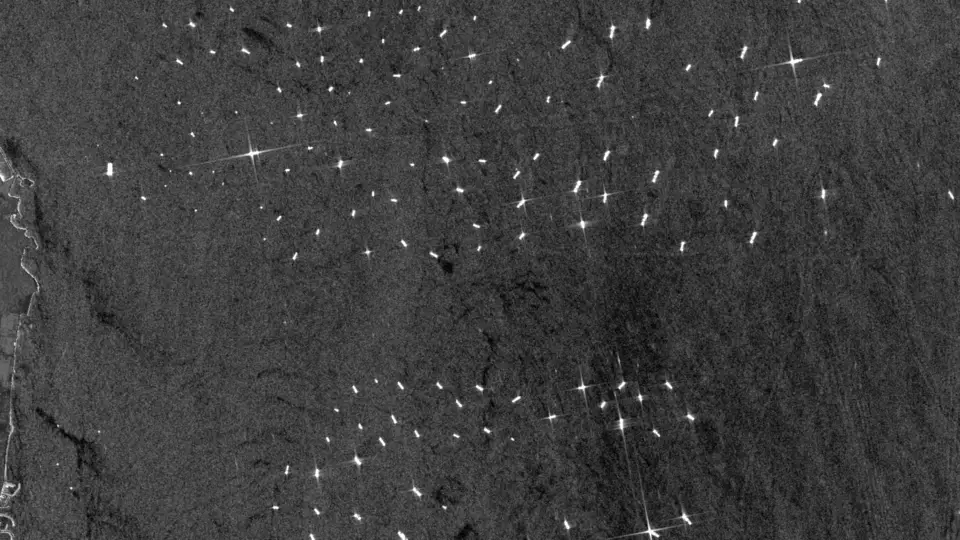
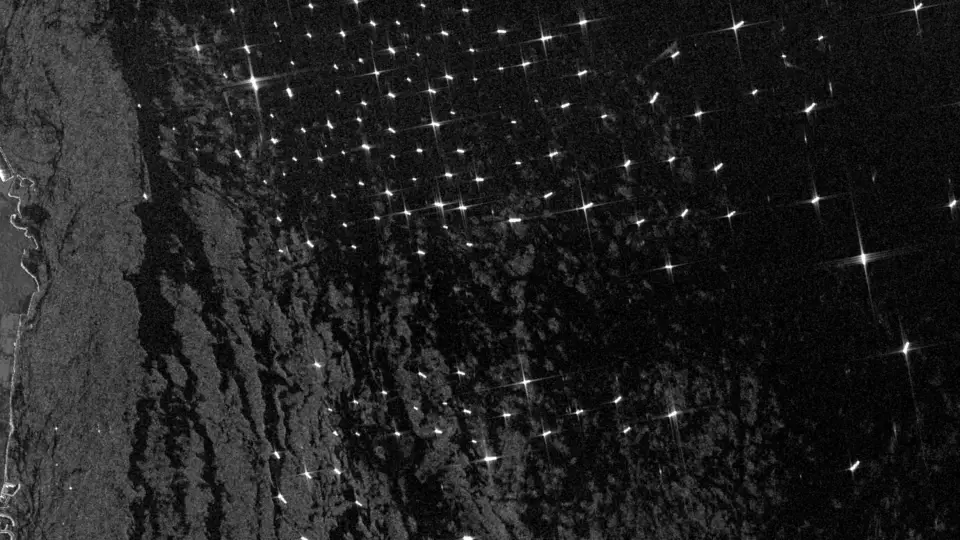
The Fujairah anchorage on Sentinel-1 radar, 13 October 2026: each bright point a ship at anchor
Case study · Strait of Hormuz · January–October 2026

The strait all but emptied. Outside it, the anchorages filled.

  • …
  • Outside it, radar satellites count far more ships at anchor off Fujairah, Khor Fakkan and Sohar than before the war. Every attack on a named ship or site is dated and sourced.

See the Hormuz case study Open 3D globe →

Strait of Hormuz · Fujairah · SoharSentinel-1 · IMF PortWatch

The Fujairah anchorage on Sentinel-1 radar, 20 February 2026, before the war
Fujairah on radar, 20 February 2026
The Fujairah anchorage on Sentinel-1 radar, 13 September 2026
Fujairah on radar, 13 September 2026
The Fujairah anchorage on Sentinel-1 radar, 13 October 2026
Fujairah on radar, 13 October 2026

Radar: contains modified Copernicus Sentinel data 2026 (Sentinel-1), ships counted by Watchfloor · ship-tracking crossings: IMF PortWatch · the finding above is read from the 3D globe's data, with its window and source.

One architecture. From the question to the report.

It watches every event, researches the question and writes the report — the sources inside.

Watch
Countries, crises, risk scores and events, as they change.
Earthquake & Disaster Impact
Every significant earthquake, with the people and buildings under it.
Research
Live sources, structured data, traceable evidence.
Report
Reports you can review, share and come back to.

Recent disasters →

Editions

The brief that finds you.

Scheduled, cited intelligence on the crises you track — delivered the moment the picture shifts.

Read the Daily Brief — every morning, by email →  ·  Products →

How Watchfloor reasons

Chaos in. A decision-ready read out.

01

Watch

Live signals, 40+ countries, every vector.

02

Reason

The architecture works the question with 60+ live tools and a panel of specialists, citing as it goes.

03

Report

What is verified, what is inferred, what to do next.

Every claim is traceable. Watchfloor shows its sources, every time. Methodology →

WATCHFLOORCRISIS INTELLIGENCE

You ask the question.

New investigation →

Sign in with Google, personal or work account. On Microsoft 365 or another work account? Write to Simone Cicchetti · simone@notamy.app and we set up your access.