How much earthquake damage can a radar satellite see?
We tested NASA–ISRO's NISAR radar building by building against Copernicus damage gradings in two 2026 earthquakes, then ran it on Panama, where we had first tried an earlier version.
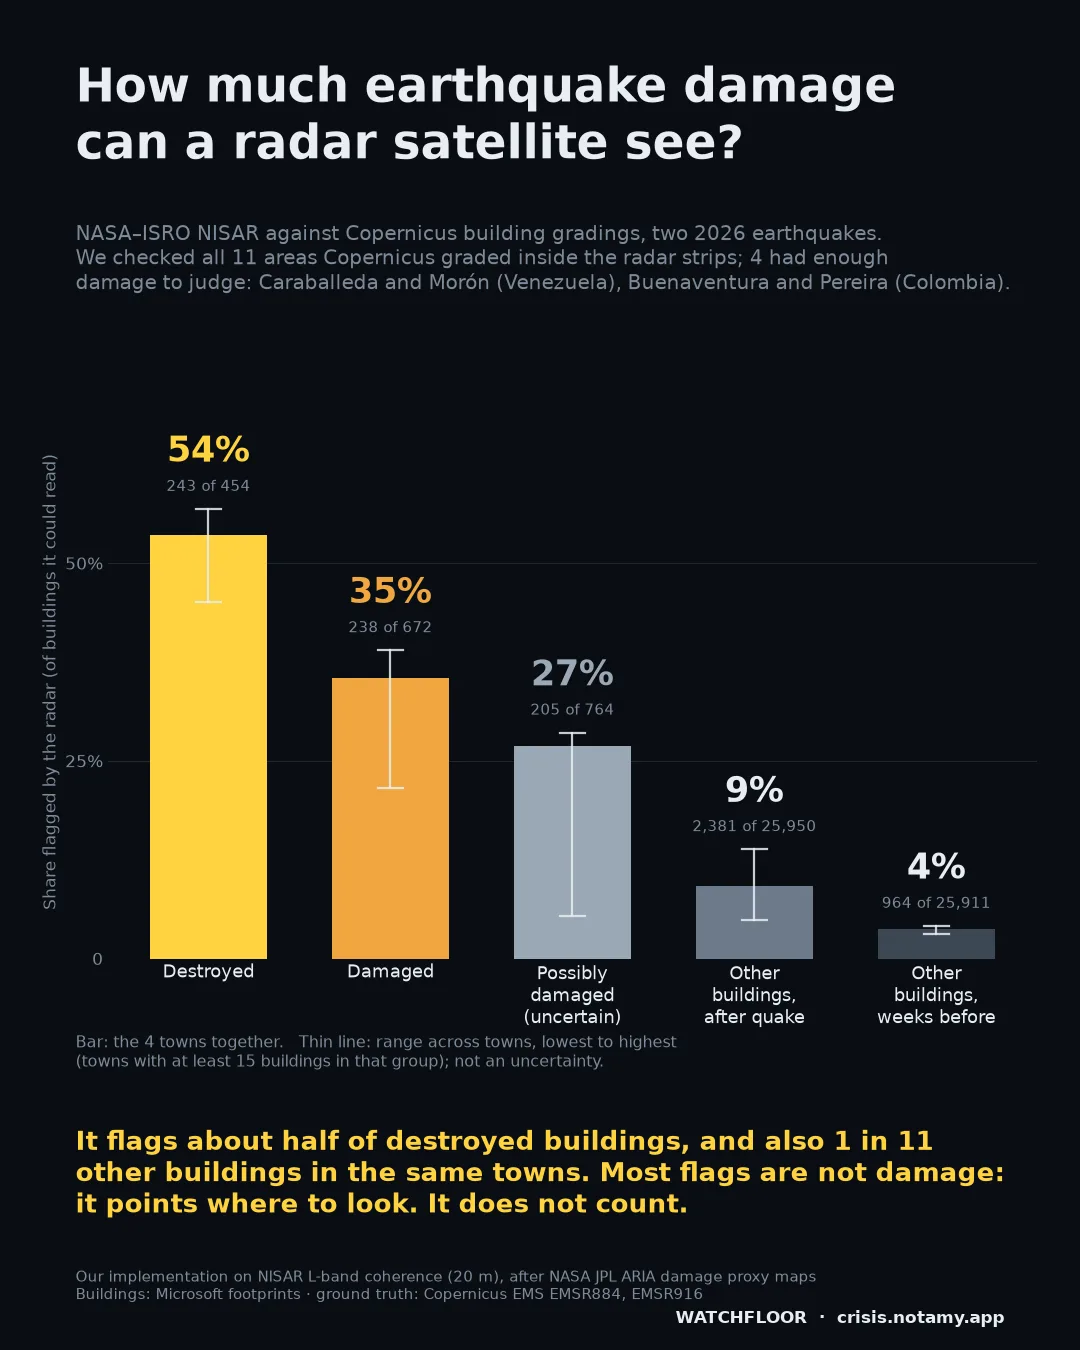
Share of buildings the radar flagged (of those it could read), four towns together
It flags about half of destroyed buildings, and also 1 in 11 other buildings in the same towns. Most flags are not damage: it points where to look. It does not count. The full chart, with the range across towns
It points where to look. It does not count.
We checked all 11 areas Copernicus graded inside the NISAR strips. Four had enough damage to judge: Caraballeda and Morón in Venezuela, Buenaventura and Pereira in Colombia. Caraballeda alone holds 63% of the destroyed buildings in these four towns. In those four towns, of the buildings the radar could read, it flagged 243 of 454 destroyed (54%) and 238 of 672 damaged (35%). It also flagged 9% of all other buildings in the same towns after the earthquake, against 4% in normal weeks.
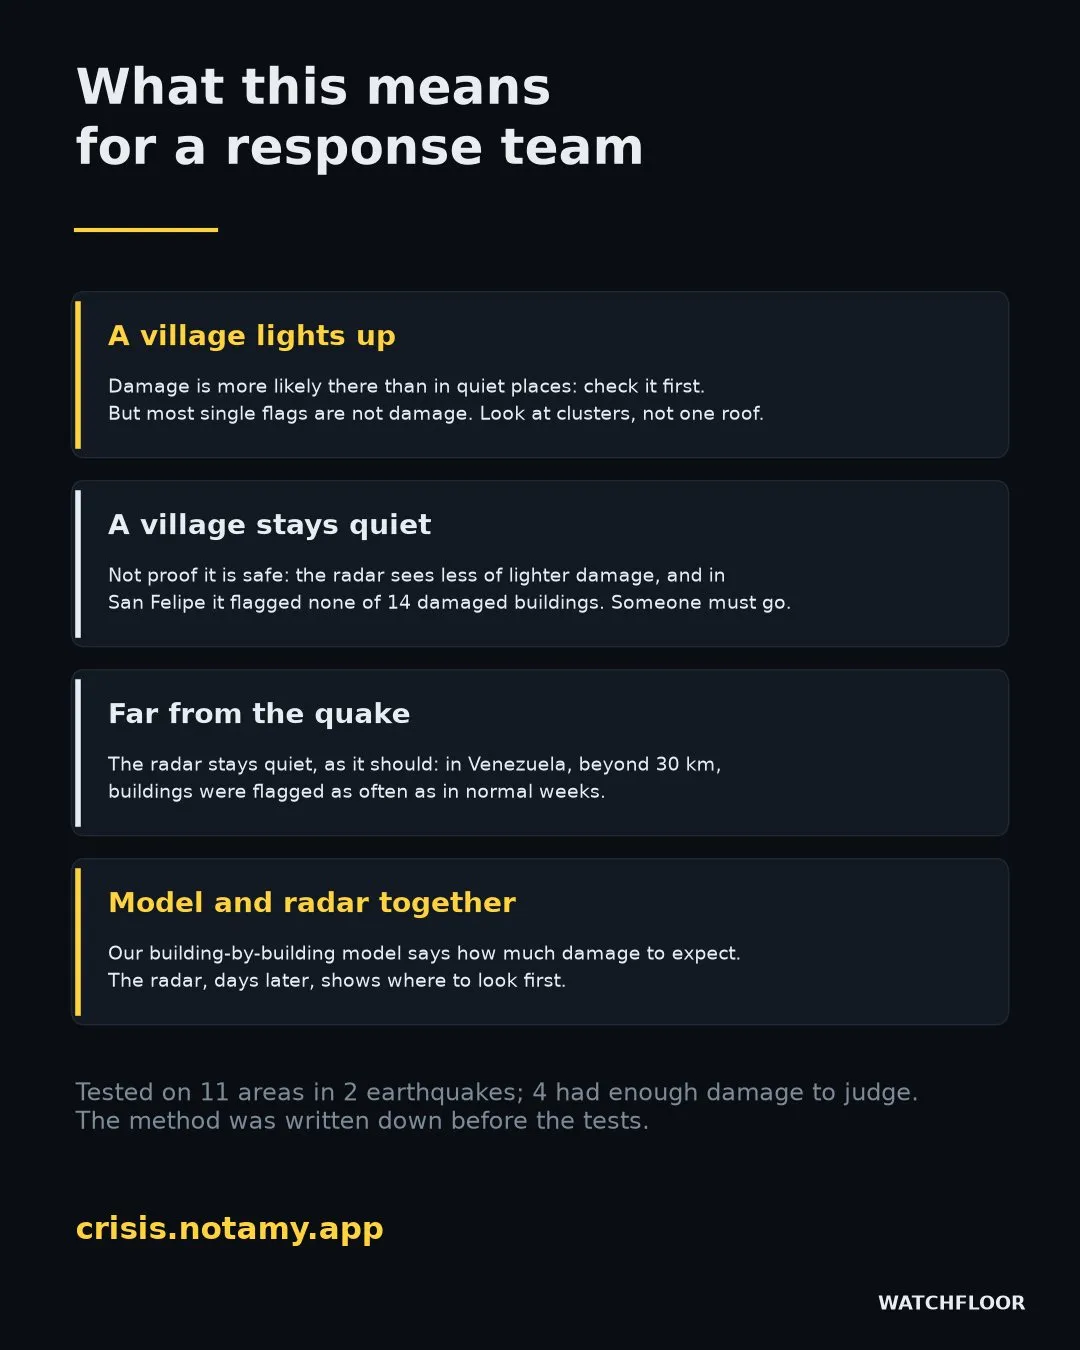
So most flags are not damage. In Buenaventura, 6 in 100 flagged buildings were ones Copernicus graded destroyed or damaged; in Pereira, 22 in 100. Some of the rest may be damage that cannot be seen from above, but we cannot show it. In San Felipe it flagged none of 14 damaged buildings. Destroyed buildings are flagged more often than damaged ones in every town with enough of both.
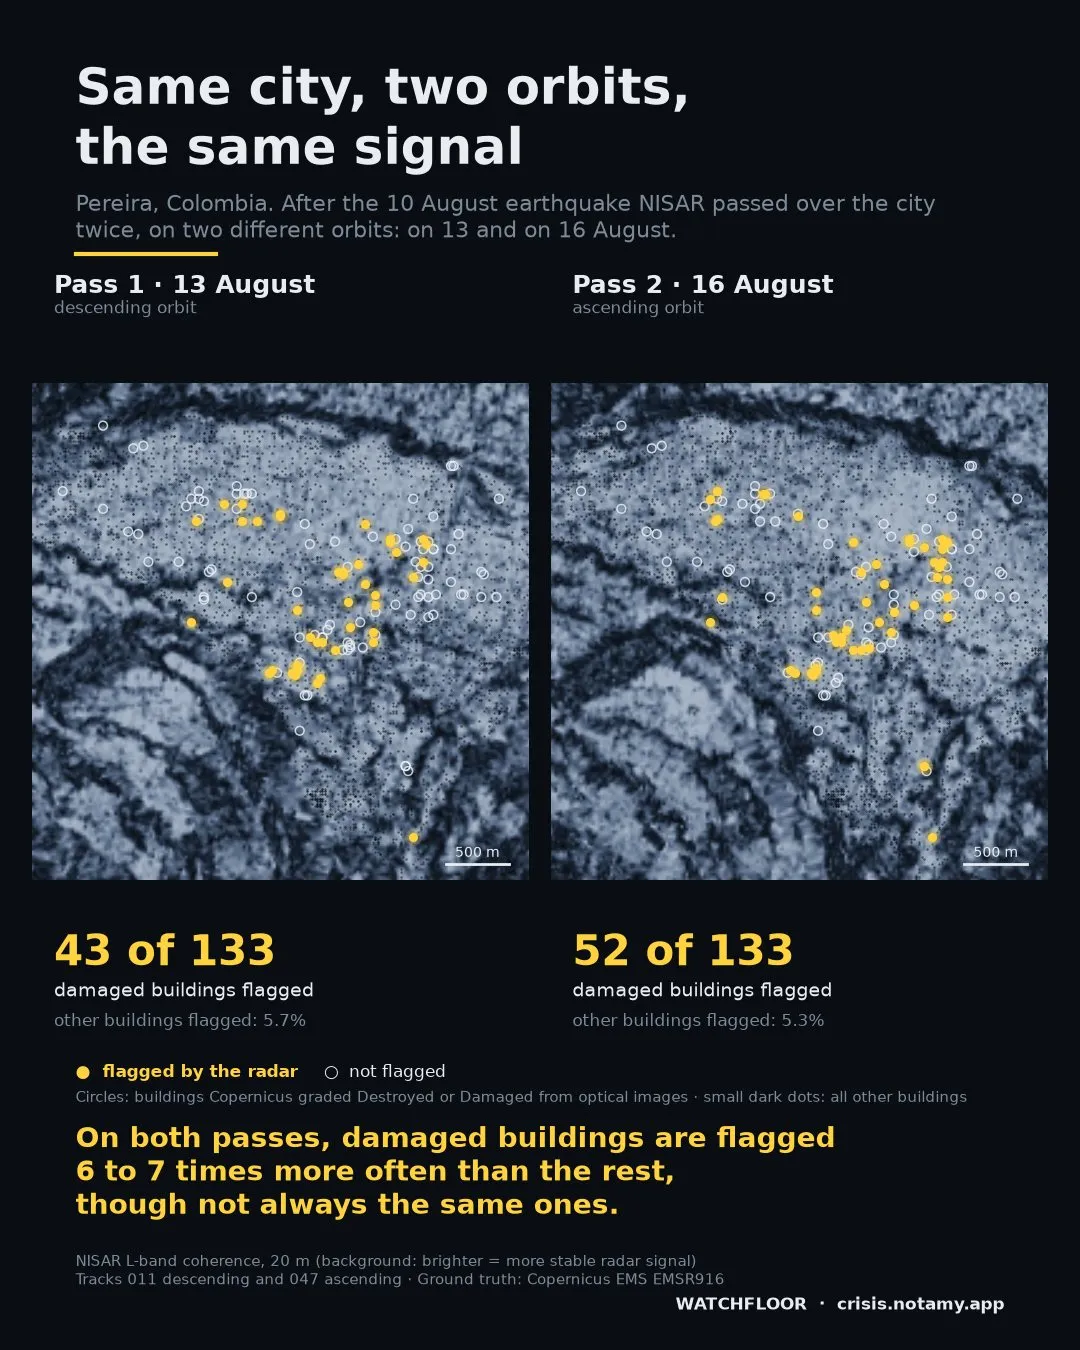
In Pereira, NISAR passed twice, on two different orbits. Both passes flag damaged buildings six to seven times more often than the rest, but they agree only in part on which ones: 23 damaged buildings were flagged by both, against about 17 expected by chance. Grouping buildings into 150 m blocks (an exploratory check) does not solve this: the radar still misses most damaged blocks. Single roofs are unreliable; clusters of flags are more informative.
Panama, 9 October: not a blind test.
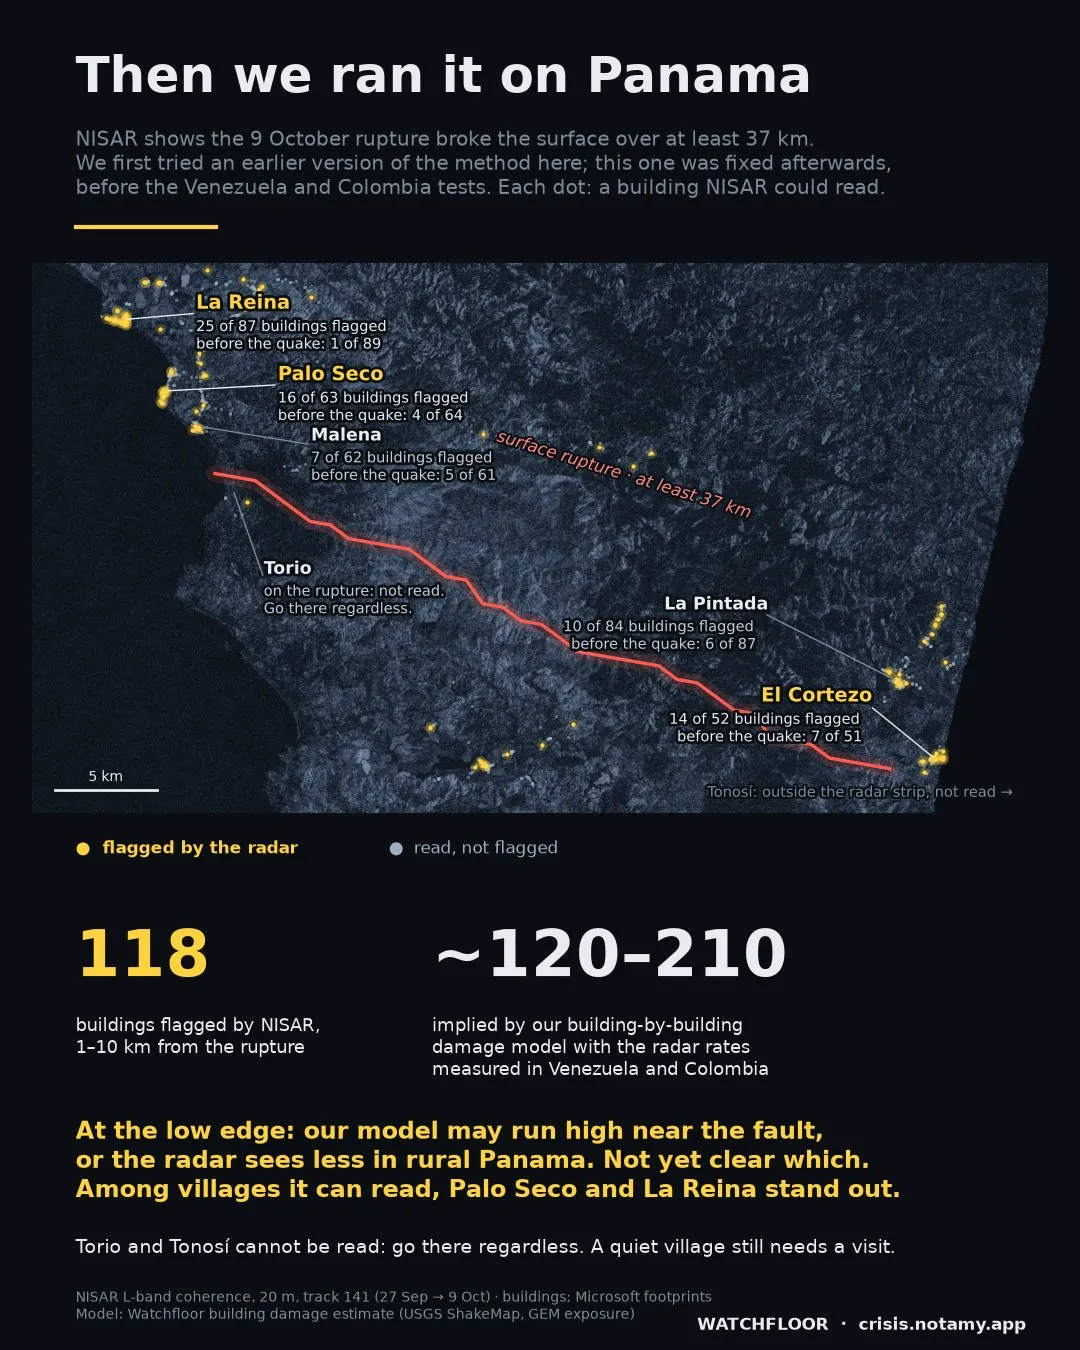
Panama was not a blind test: we first tried an earlier version of the method there, and fixed the current one afterwards, before the Venezuela and Colombia tests. The radar shows at least 37 km of clear offset along the rupture (the mapped trace on the live map is 39 km). Within 1–10 km of the rupture, NISAR flagged 118 of 817 buildings it could read. Combining our building-by-building damage model with the radar rates measured in the four towns gives roughly 120 to 210. 118 sits at the low edge: either our model runs high near the fault, or the radar sees less in rural, vegetated Panama than in the cities where we measured it. We cannot yet tell which. The model's "may be uninhabitable" and Copernicus's "damaged" are close but not the same thing.
Among the villages the radar can read, Palo Seco (16 of 63 buildings flagged; 4 of 64 before the quake) and La Reina (25 of 87; 1 of 89) stand out. We picked La Reina after seeing its signal. In Malena and La Pintada the radar sees no clear change. Torio, on the rupture, is not read: right beside it, ground movement alone can change the signal. Tonosí lies outside the radar strip. Go to both regardless.
Every area Copernicus graded inside the radar strips.
| Area | Destroyed | Damaged | Possibly damaged | Other buildings, normal weeks |
|---|---|---|---|---|
| Caracas (VEN) | — | — | — | 14 of 250 (6%) |
| Santa Cruz (VEN) | 2 of 2 | — | — | 1,766 of 67,226 (3%) |
| Morón (VEN) | 7 of 8 | 10 of 28 (36%) | 2 of 37 (5%) | 134 of 3,826 (4%) |
| San Felipe (VEN) | — | 0 of 14 | 6 of 135 (4%) | 3,294 of 66,514 (5%) |
| Caraballeda (VEN) | 162 of 285 (57%) | 166 of 426 (39%) | 193 of 676 (29%) | 410 of 9,970 (4%) |
| Cali nord (COL) | 0 of 2 | 1 of 3 | 0 of 2 | 85 of 4,699 (2%) |
| Cali centro (COL) | 1 of 7 | 0 of 2 | 0 of 3 | 16 of 728 (2%) |
| Buenaventura (COL) | 46 of 102 (45%) | 45 of 139 (32%) | 7 of 33 (21%) | 340 of 9,488 (4%) |
| Pereira (COL) | 28 of 59 (47%) | 17 of 79 (22%) | 3 of 18 (17%) | 80 of 2,627 (3%) |
| Quibdó (COL) | 3 of 12 | 1 of 7 | 8 of 37 (22%) | 188 of 8,575 (2%) |
| Istmina (COL) | 0 of 1 | 2 of 9 | — | 36 of 685 (5%) |
| All 11 areas | 249 of 478 (52%) | 242 of 707 (34%) | 219 of 941 (23%) | 6,363 of 174,588 (3.6%) |
Buildings flagged by the radar after the earthquake, out of those it could read. Latest Copernicus product for each area; buildings within 15 m of each other counted once. Percentages shown from 15 buildings up. "Possibly damaged" is Copernicus's grade for an uncertain reading, not a lighter grade of damage. Neighbouring buildings can share one 20 m radar pixel, so these counts are not fully independent.
Rules written down before the results.
For each building we compare how stable the radar signal stayed between two passes before the earthquake with how stable it stayed between the last pass before and the first pass after it. A building is flagged when its signal lost clearly more stability than the land around it. The rules were written down and fixed before we looked at the test results, and they were not changed afterwards. Choices that came later, stated: for each area we use the latest Copernicus product; two Venezuelan areas (Caracas and Caraballeda) were missed in our first pass and added with the same code; the split by damage grade was first explored in Venezuela and then tested as a written prediction in Colombia, where it held only in part. In Colombia the after-quake image pair spans 24 days (one pass was missing) against 12-day reference pairs, so background change is higher there.
Not every written test passed. A test that buildings change more than bare ground nearby passed in Morón but failed across all areas combined. Far from the earthquake (beyond 30 km, Venezuela) the radar flagged buildings as often as in normal weeks, as it should.
Radar damage proxy maps built from this kind of signal were pioneered by NASA JPL's ARIA team. This is our own implementation on NISAR coherence. What we add is a measurement: how it performs, grade by grade, against buildings that people graded from optical images. Watchfloor's building model reads Google Open Buildings footprints and, where they have none, Microsoft's and OpenStreetMap's (through Overture Maps); the radar test on this page used Microsoft's footprints.
Official figures and Copernicus first.
Sources: NASA–ISRO NISAR L2 GUNW and GOFF products, distributed by the Alaska Satellite Facility DAAC · Copernicus Emergency Management Service EMSR884, EMSR916 © European Union, CC BY 4.0 · Microsoft Global ML Building Footprints, ODbL · USGS ShakeMap · GEM Global Exposure Model. Radar flags, rates and the Panama comparison: Watchfloor measurements. All credits