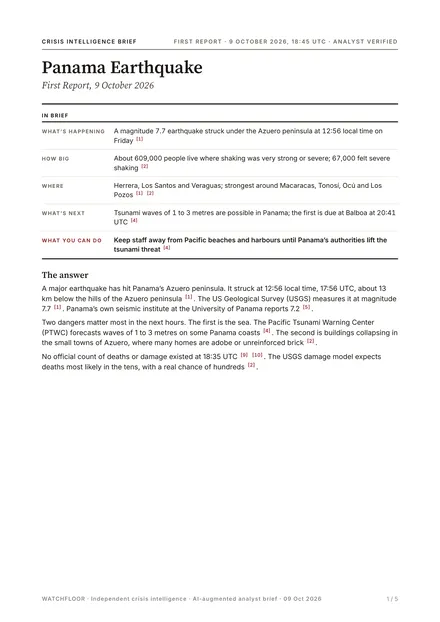
When disaster strikes, Watchfloor runs an agentic analysis architecture: its agents read the platform's own measurements and every dated source, every figure of the draft is checked against its source, and a person approves the report before it reaches you. Around it, one live map shows who is in the path, from the whole world down to the building.
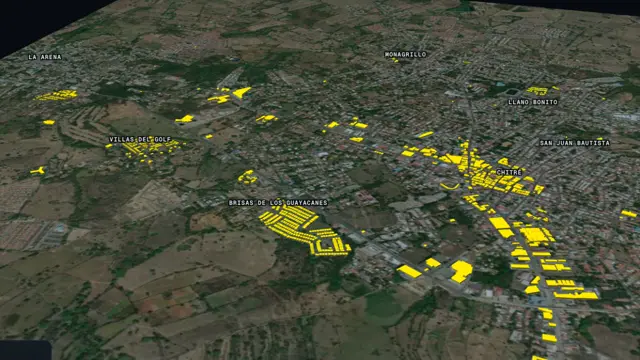
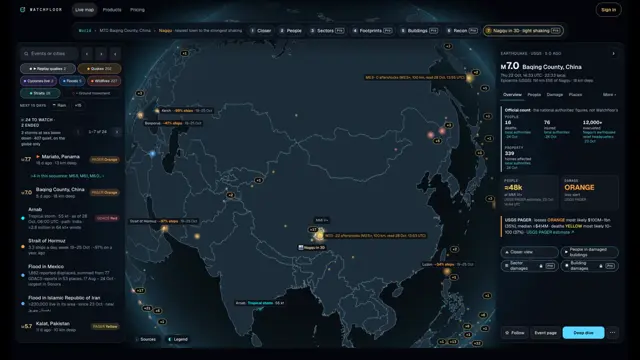
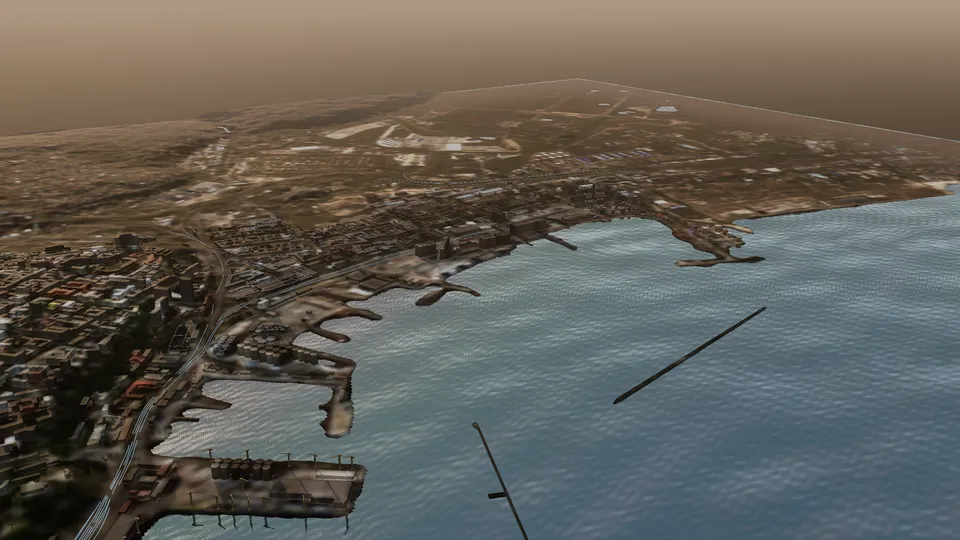
Every screen is Watchfloor as it runs today: the magnitude 7.7 earthquake in Panama of 9 October, from the live map down to the town of Chitré in 3D, and what is happening this week.
Narrated, with subtitles. The opening's desk and operations-room scenes are illustrative (AI); every map and figure is a real Watchfloor capture of 28 October 2026.
Behind the map, Watchfloor's agents read the platform's own measurements first, then the dated public sources on your question and your own documents, side by side. The report puts the answer first, every figure sourced and dated, and a person approves it before it reaches you.
A real run, replayed: the data reads, the investigation, the draft, the checks on the draft in red, the synthesis, the document. Your own report draws this room live on its page while it is written.
An assessment with every figure sourced and dated.
Drivers ranked, each with the evidence for and against.
An outlook with the signals that would change it.

2,662 buildings, each coloured by the shaking USGS measured there after the Panama earthquake.

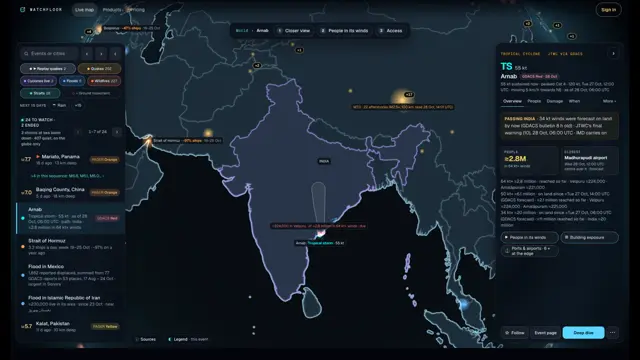
This week's earthquakes, storms, floods and straits. Tap one: people, damage, aftershocks, sources.

The storms, earthquakes and floods of the last hours, with the people in their path.

The Kerch Strait closed on 10 July: one ship through it in all of September, against 11 a day in June. The ports, the grain, who pays.

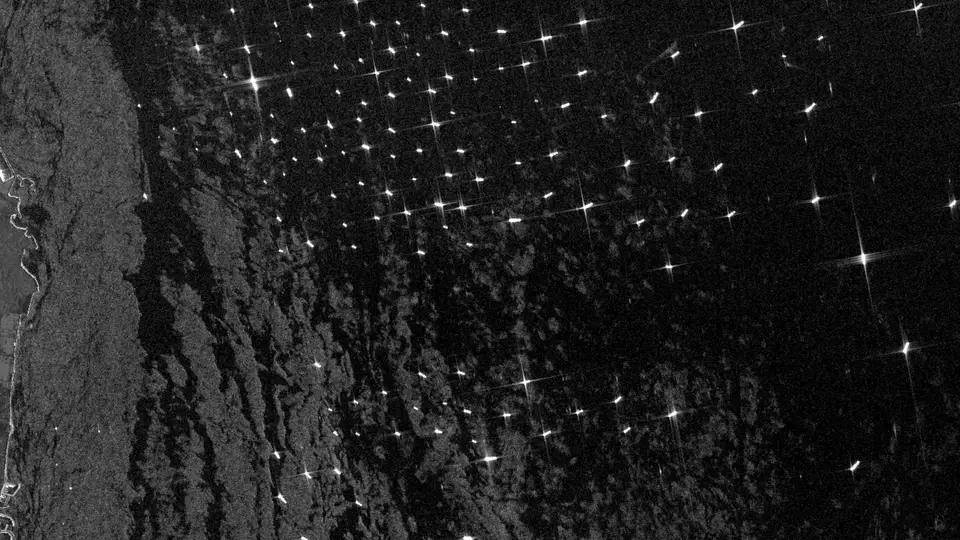
Few ships through, many at anchor outside: ship-tracking and radar satellites agree, and every attack on a named ship is dated.

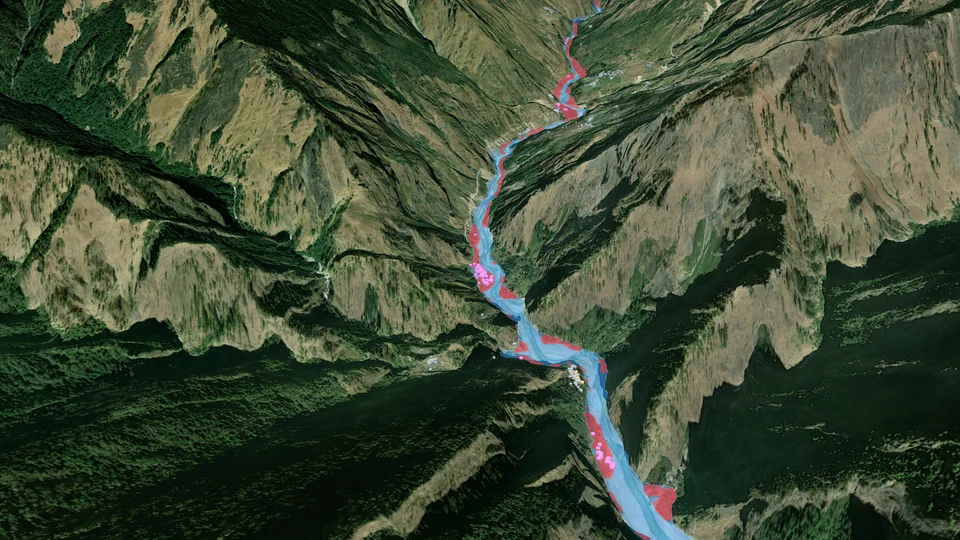
A blocked stream gave way before dawn on 11 October: satellite images before and after, and every building along 65 km of river, in 3D.
And the first one: Venezuela · the earthquakes of 24 June →
Our estimate of damaged buildings, against Microsoft's AI for Good Lab assessment of every building with usable imagery: 143,472 buildings, 752 damaged or possibly damaged (Microsoft). How it was measured
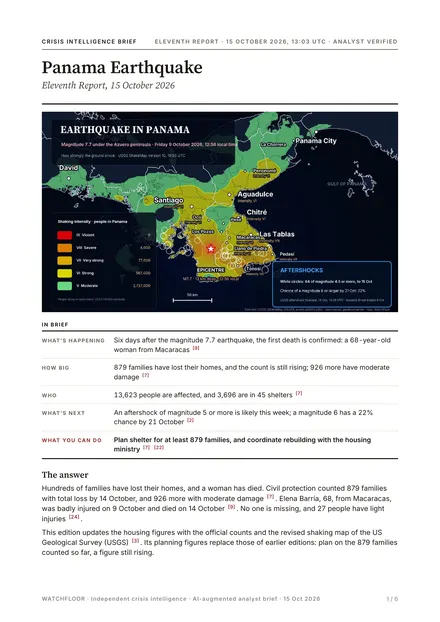
The first on 9 October at 18:45 UTC, the eleventh on 15 October: each one following the figures as they changed.


A range, never a single number. The width of the range is the uncertainty; when USGS publishes its PAGER estimate, PAGER leads.
A probability for every 150 m block, read from the real ShakeMap and labelled indicative: the resolution the evidence has.
Observed beats modelled: satellite assessments are shown first. Figures carry their source and date; damage estimates name the ShakeMap version.
Which towns, how many people, which sectors to search first, and what the official sources have confirmed so far.
Your sites and portfolio against the shaking, the winds or the water, with the buildings counted and the estimates dated.
Ships a day through the world's straits against a year ago, and the ports and routes behind them.
Our stand is A3-60 in Pavilion 2 (ALPHA), on Thursday 12 November. Fifteen minutes is enough to run your own countries, sites or portfolio through the live map with us. Book a slot on the 12th to meet us at the stand; book one on the 10th or 11th and we will meet you in the venue. Times are Lisbon time.
In the first hours after a disaster, the facts exist, but they are scattered. Watchfloor joins them up so a team knows who is hit and where, while it still matters.
The opening loop and the film's opening: desk and operations-room scenes illustrative (AI); maps and figures: real Watchfloor capture. Sources: USGS event us6000u18k, ShakeMap v11 of 17 October 2026 and PAGER · buildings © OpenStreetMap contributors, ODbL · imagery: Esri and its providers · Pereira: Microsoft AI for Good Lab, via HDX, CC BY 4.0 · storms: JTWC via GDACS · straits: IMF PortWatch. People in damaged buildings, sector and building figures: Watchfloor estimates, explained on the methodology page.